Insider Trading Tips, Other
Intel: Babcock share price – Buy or Sell – expectation
Jun
Babcock Share Price Analysis (June 2025)
Powered by Quantina.co.uk
Overview & Recent Performance
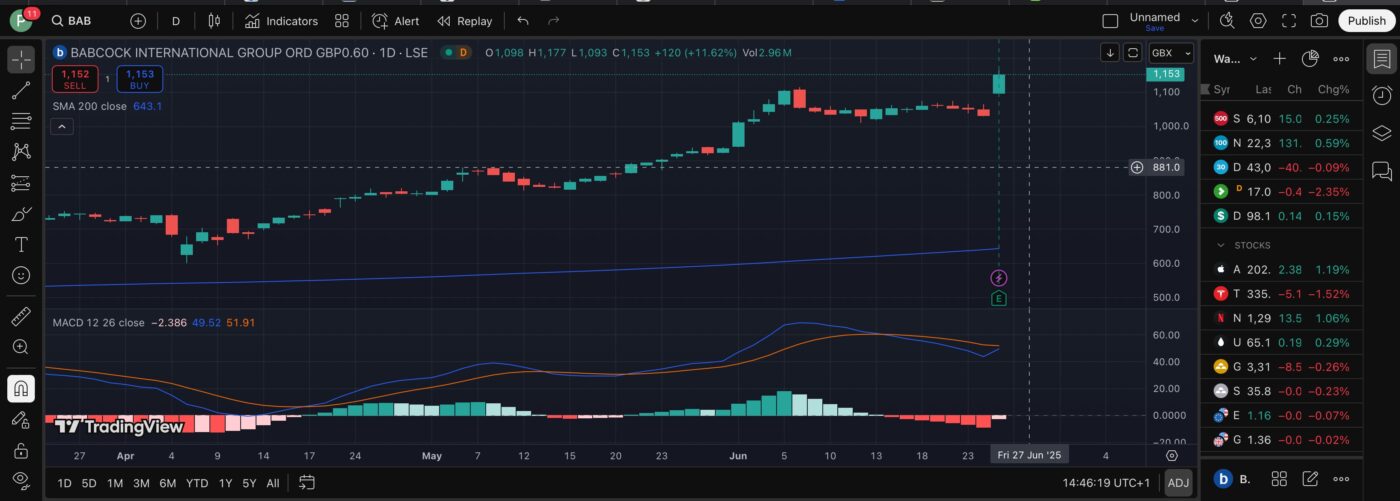
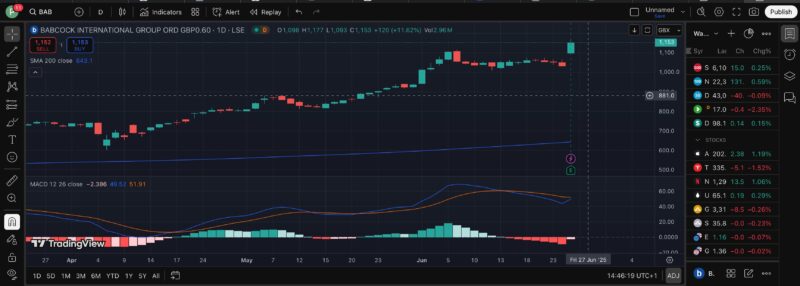
Babcock International (LSE: BAB) surged ~13% on 25 June 2025, following upbeat results, growing dividends, a £200 m share buyback, and NATO’s defence-spending uplift. It’s now trading at ~1,174 pence, near its 52‑week high.
Analyst Targets & Forecasts
- Wall Street average target: ~1,058 GBX
- European consensus: ~823 GBX
- Long-term forecast: ~1,699 GBX by 2030
For more accurate forecasts, visit Quantina Stock Forecast.
Technical Indicators: MACD & RSI
- RSI (14): ~35.5 → neutral-to-oversold
- MACD (12,26): –3.06 → bearish momentum
Mixed indicators suggest short-term caution. For educational insights, visit Quantina Trading Strategies.
Chart Trend Overview
Currently trading well above the 200-day moving average. Key levels:
- Support: ~1,033 p
- Resistance: ~1,176 p (all-time high)
Short‑Term vs Long‑Term Strategy
| Horizon | Strategy |
|---|---|
| Short-term | Wait for a pullback near 1,033 p; confirm MACD/RSI reversal |
| Long-term | Consider entry near 800–900 p based on analyst fair-value targets |
When to Buy?
- Buy near 1,100–1,150 p if MACD crosses positive and RSI exceeds 50
- Ideal entry: 800–900 p zone for long-term investors
Join our investment alerts at Quantina Investment Alerts.
https://www.tradingview.com/chart/aDGVg5yg/?symbol=LSE%3ABAB
⚠️ Risks to Watch
- High valuation: elevated P/E (~27.5×)
- Geopolitical volatility and sentiment shifts
- MACD/RSI divergence may indicate correction
✅ Final Take
- Short term: Technicals say wait
- Long term: Defence sector tailwinds support growth
Track more share price trends and insights at Quantina Blog.
Call to Action
Set alerts around 1,175 p resistance and 1,033 p support. Watch MACD for bullish crossovers. Build your long-term position near 900 p. Want passive income instead? Join Quantina Debenture for 8% fixed yearly return.