cTrader Indicator • Candlestick Analytics • Advanced Filter
Quantina PhantomII Candlestick Pattern Indicator - Advanced Filter
Quantina PhantomII is an advanced algorithmic candlestick-pattern recognition and statistical analysis indicator for cTrader. It scans the chart in real time, detects selected price-action formations, validates signals with optional technical filters, calculates risk-based Stop Loss and Take Profit levels, and measures how recent signals have actually performed.
Turn Candlestick Patterns Into Measurable Trading Data
Traditional candlestick indicators often stop at pattern recognition. PhantomII goes further by combining pattern detection, technical confirmation, chart visualisation and rolling performance statistics in one interface.
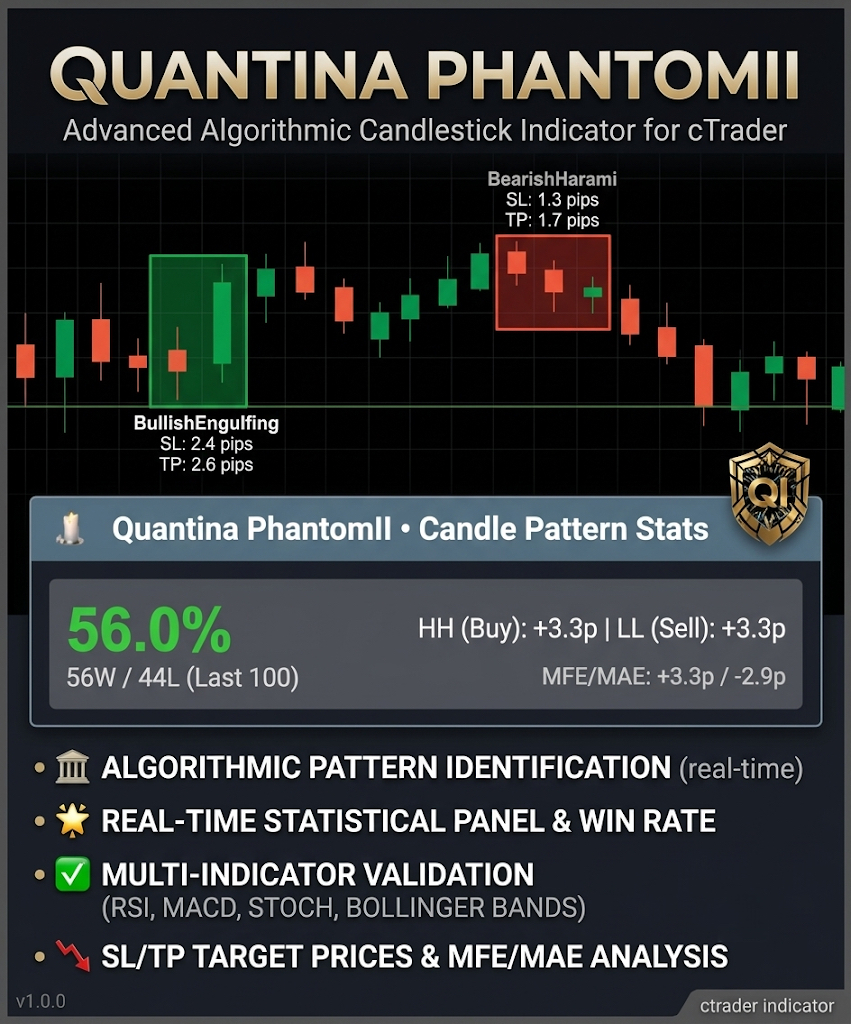
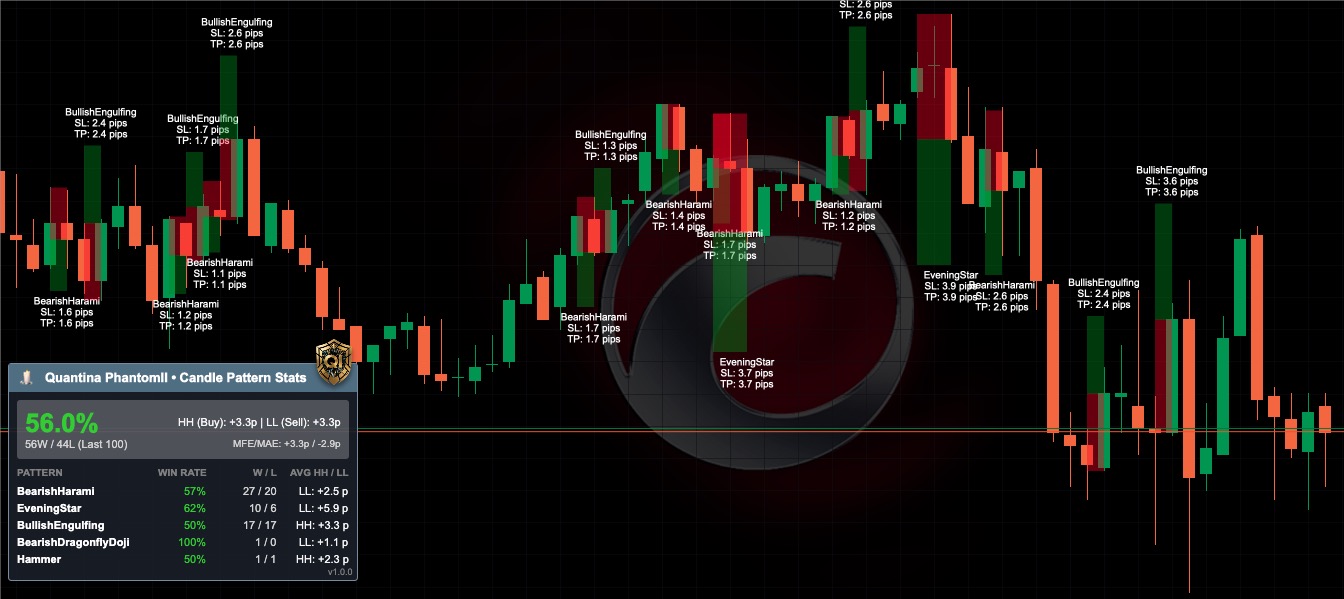
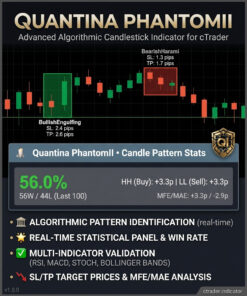
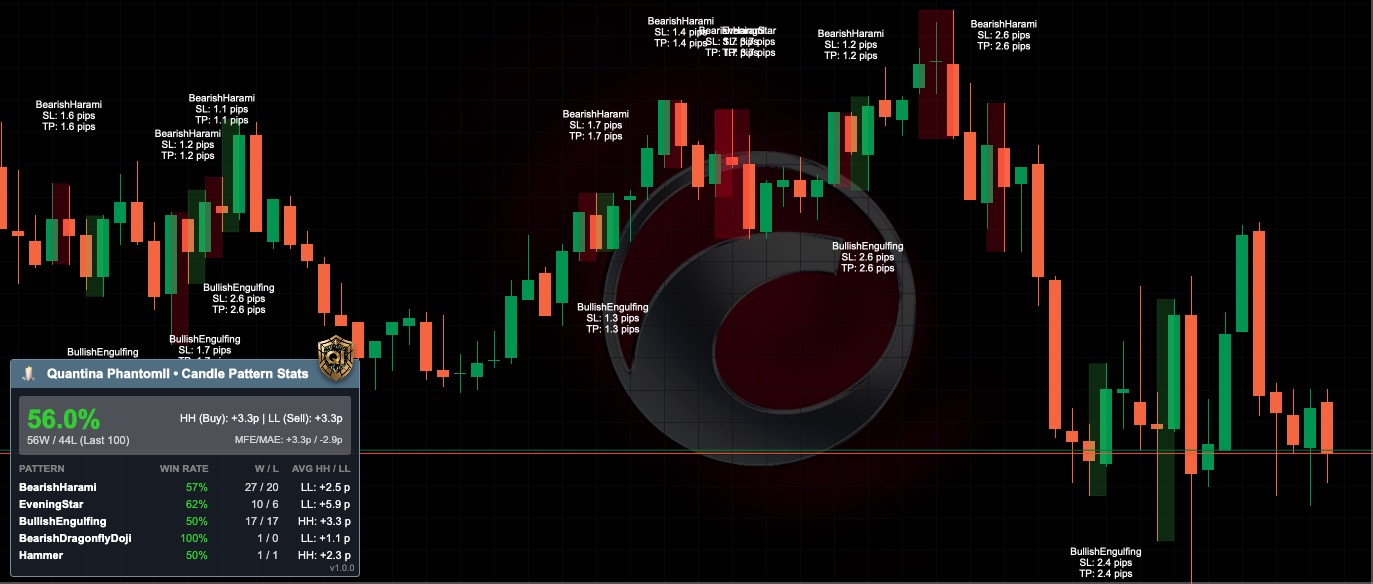
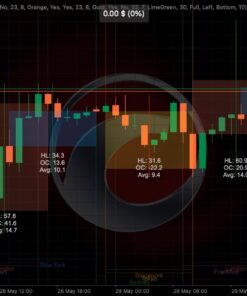
Instead of showing a symbol and leaving the trader to interpret it manually, PhantomII can display the pattern area, proposed SL/TP distance, recent win/loss results and post-signal price excursion statistics directly on the chart.
Algorithmic Pattern Recognition
Automatically searches for supported bullish, bearish, reversal and continuation formations using structural candle rules.
Advanced Signal Filtering
Optional EMA, RSI, MACD, Bollinger Bands and Stochastic confirmations help reduce low-quality standalone pattern signals.
Live Statistical Panel
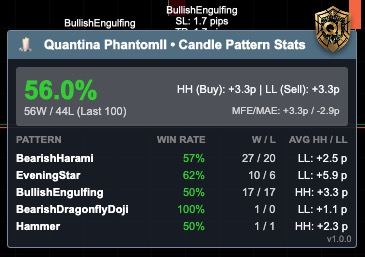
Tracks recent signals and displays win rate, win/loss totals, average HH/LL and MFE/MAE measurements.
Real-Time Statistical Panel
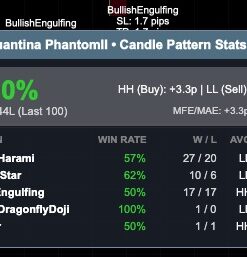
PhantomII includes an integrated performance panel designed to show how recently detected signals behaved after appearing. The user can define the number of historical signals to analyse and the number of bars used to evaluate the outcome.
Panel Metrics Explained
| Metric | Meaning | Practical Use |
|---|---|---|
| Win Rate | Percentage of recent evaluated signals classified as wins. | Quickly compare how the currently selected pattern behaves on the active market and timeframe. |
| W / L | Total wins and losses for each pattern. | Shows the sample composition behind the win-rate percentage. |
| AVG HH / LL | Average Highest High after buy signals or Lowest Low after sell signals, measured in pips. | Helps estimate the average favourable directional move after a signal. |
| MFE | Maximum Favorable Excursion. | Shows how far price moved in the expected direction at its best point. |
| MAE | Maximum Adverse Excursion. | Shows the maximum adverse move during the evaluation period. |
Statistics are calculated from historical/chart observations and are not a guarantee of future trading performance.
Two Visualisation Modes
1. Highlight Mode
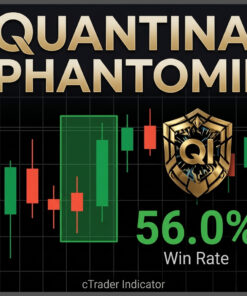
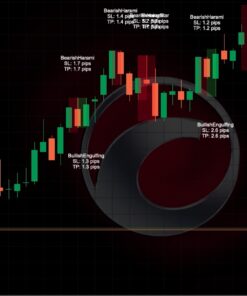
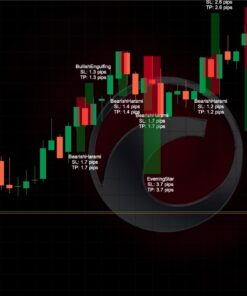
PhantomII can highlight the exact candles that form a detected pattern. Bullish formations can be shown with a green highlight and bearish formations with a red highlight. The pattern name and calculated SL/TP distance are displayed close to the signal.
2. Risk/Reward Mode
Risk/Reward mode uses cTrader’s built-in Risk/Reward drawing object. The indicator plots a risk zone and target zone around the detected setup, based on the pattern’s local high/low, ATR-based padding and the selected Reward multiplier. When interactive mode is enabled, the user can manually adjust the displayed target levels on the chart.
Supported Candlestick Patterns
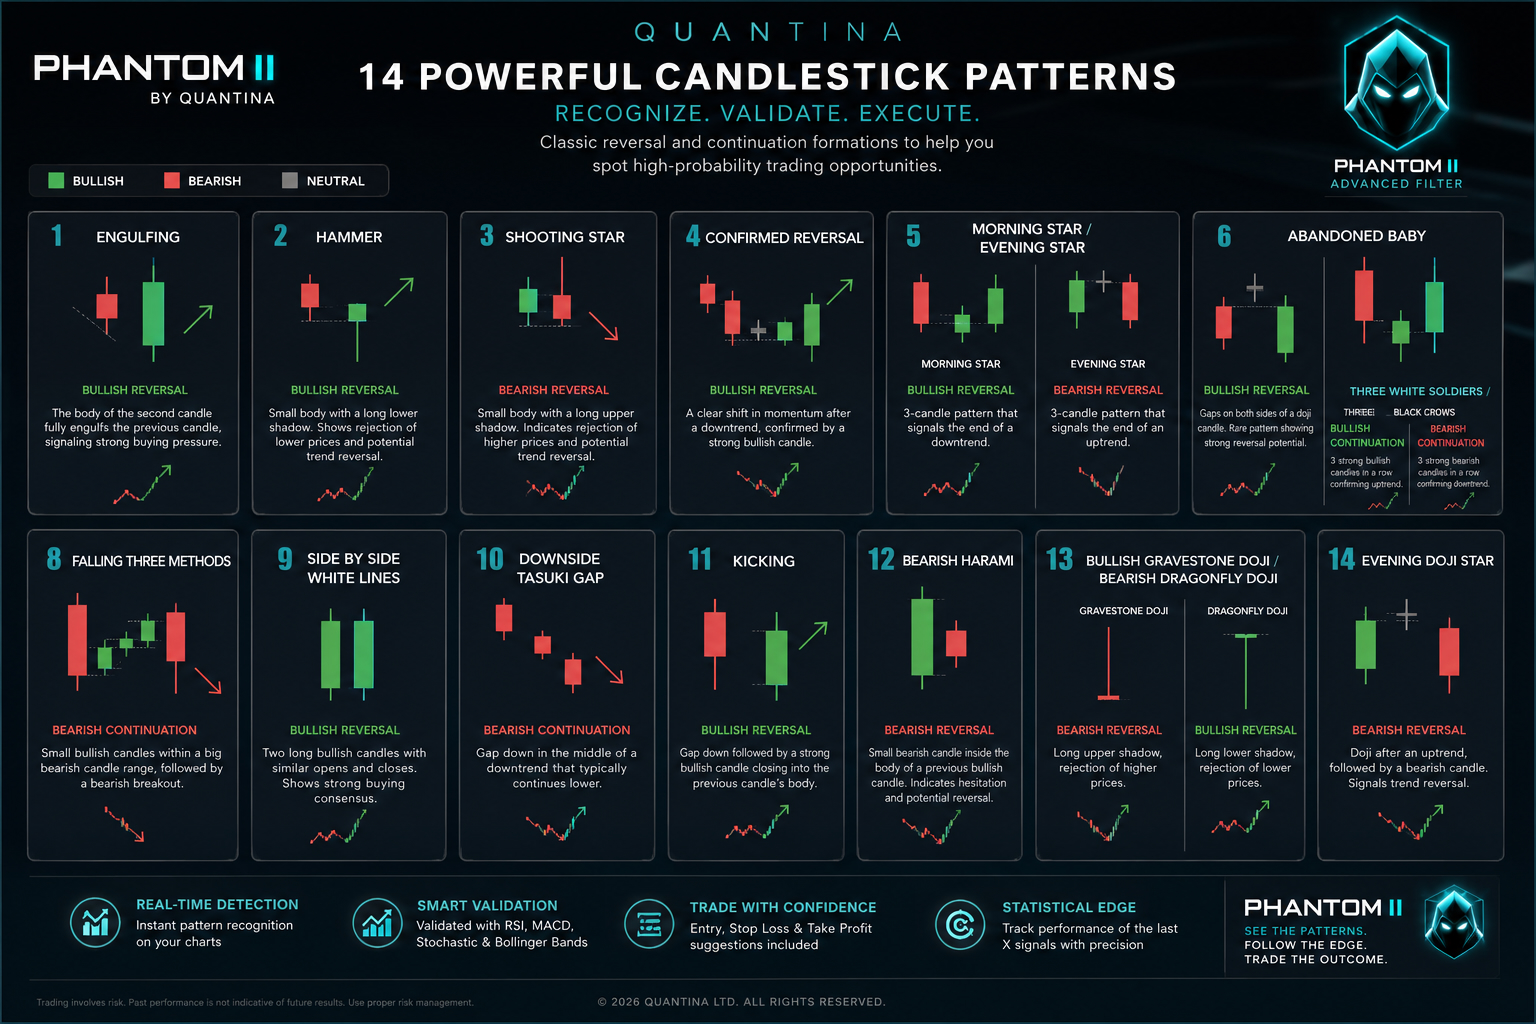
PhantomII supports a broad set of classic reversal and continuation formations.
Type: Reversal
Direction: Bullish / Bearish
Two-candle body engulfing structure with a minimum body size filter. Optional EMA, RSI and MACD confirmation can be applied.
Type: Reversal
Direction: Bullish
Small body, long lower wick and minimal upper wick. Can validate with Lower Bollinger Band penetration, Stochastic oversold and RSI oversold/exiting-oversold conditions.
Type: Reversal
Direction: Bearish
Small body, long upper wick and minimal lower wick. Can validate with Upper Bollinger Band penetration, Stochastic overbought and weakening MACD momentum.
Type: Reversal
Direction: Bullish / Bearish
Hammer or Shooting Star followed by a confirming candle. Optional MACD cross and RSI momentum validation.
Type: Reversal
Direction: Bullish / Bearish
Classic three-candle reversal sequence with optional EMA and RSI confirmation.
Type: Strong Reversal
Direction: Bullish / Bearish
Three-candle structure with a Doji and price gaps, optionally validated with EMA, RSI and Stochastic extremes.
Type: Reversal
Direction: Bullish / Bearish
Three decisive directional candles following a prior trend, with optional EMA and RSI momentum confirmation.
Type: Continuation
Direction: Bearish
Five-candle bearish continuation structure with optional EMA and volume validation.
Type: Continuation
Direction: Bullish
Three bullish candles with gap behaviour and optional EMA and volume confirmation.
Type: Continuation
Direction: Bearish
Three-candle bearish gap continuation pattern with optional EMA and RSI momentum validation.
Type: Extremely Strong Reversal
Direction: Bullish / Bearish
Opposing Marubozu-style candles separated by a gap, optionally confirmed by trend and volume conditions.
Type: Reversal
Direction: Bearish
Large bullish mother candle followed by a smaller bearish candle within its body. Can require RSI and Stochastic overbought validation.
Type: Local Reversal
Direction: Bullish / Bearish
Doji-based exhaustion structures validated by the appropriate RSI and Stochastic extremes.
Type: Reversal
Direction: Bearish
Three-candle top reversal structure with strongly overbought RSI and Stochastic confirmation.
Advanced Filter System
Every trader can decide whether PhantomII should display the raw candlestick setup or require additional market confirmation. The confirmation modules are configurable independently.
EMA Filter
Uses price position relative to a configurable EMA period, including EMA 200 trend filtering.
[/icon_box]RSI Filter
Configurable RSI period and overbought/oversold thresholds help identify momentum extremes.
[/icon_box]MACD Filter
Configurable fast, slow and signal periods can be used for histogram direction and cross confirmation.
[/icon_box]Bollinger Bands
Configurable MA type, periods and standard deviation settings can validate wick penetration and volatility context.
[/icon_box]Stochastic Filter
Adjustable %K, %D, slowing and threshold values provide overbought/oversold confirmation.
[/icon_box]ATR-Based Risk Logic
ATR-derived padding helps place the suggested Stop Loss beyond the local structure instead of using a fixed arbitrary distance.
[/icon_box]Risk Management & Target Calculation
Each supported setup includes a built-in risk-management routine. PhantomII calculates a technical Stop Loss around the local price structure and applies ATR padding. The Take Profit is then calculated from the selected Reward multiplier.
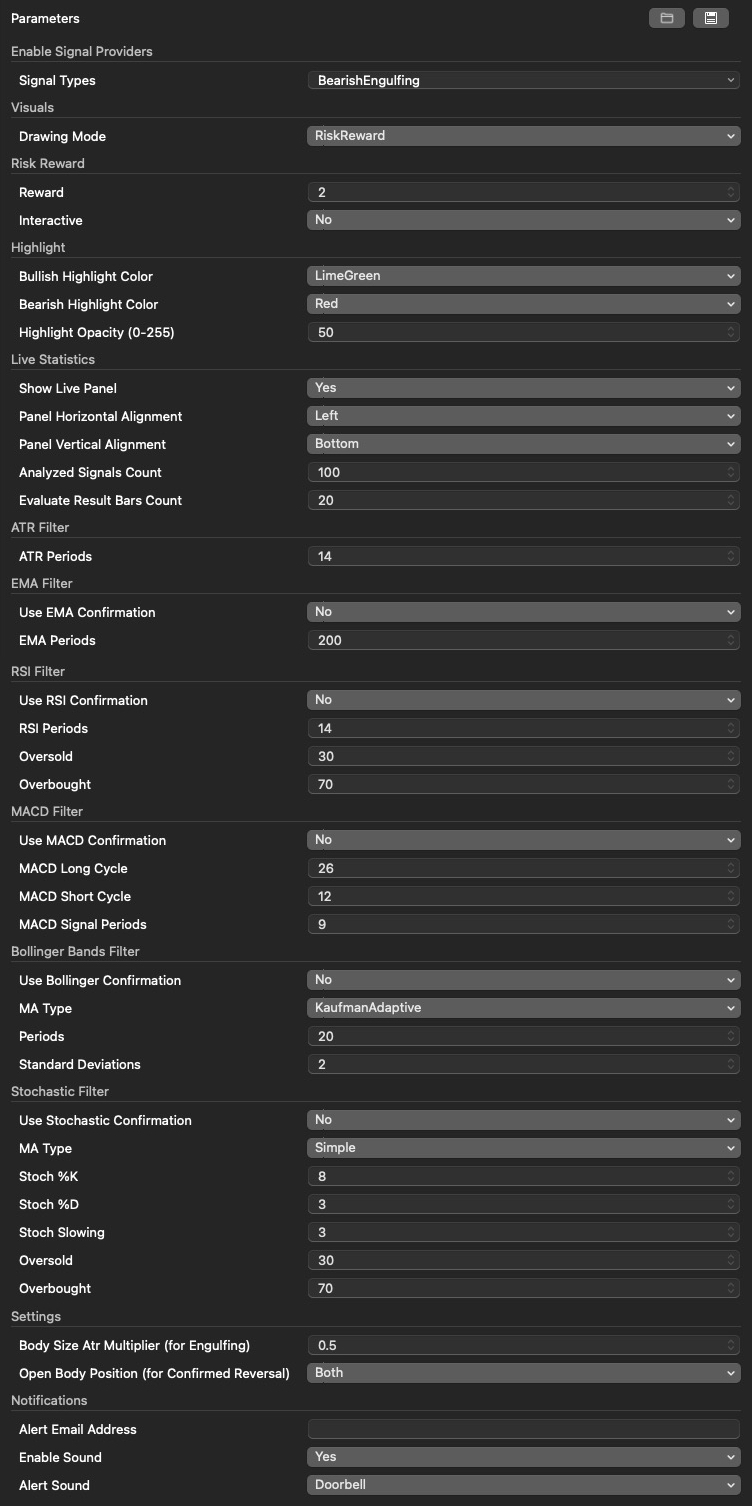
Key Parameters
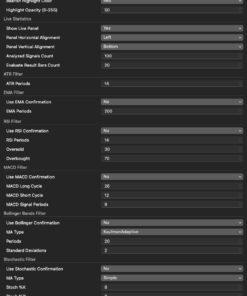
| Parameter Group | Example | Purpose |
|---|---|---|
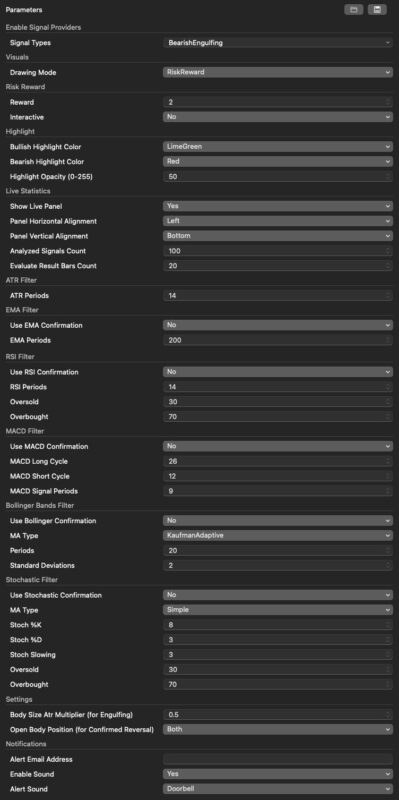
| Signal Types | Bearish Engulfing | Select the candlestick formation to analyse. |
| Drawing Mode | Highlight / RiskReward | Choose how signals are visualised on the chart. |
| Reward | 2 | Defines the reward multiple used for the suggested Take Profit. |
| Interactive | Yes / No | Allows adjustment of Risk/Reward objects where supported. |
| Analysed Signals Count | 100 | Number of recent signals included in rolling statistics. |
| Evaluate Result Bars Count | 20 | Number of bars used to evaluate the post-signal result. |
| ATR Period | 14 | Controls volatility calculations and risk padding. |
| EMA Confirmation | EMA 200 | Trend-direction filter. |
| RSI Confirmation | 14 / 30 / 70 | Momentum and overbought/oversold filtering. |
| MACD Confirmation | 12 / 26 / 9 | Momentum and cross-direction validation. |
| Bollinger Confirmation | 20 / 2 deviations | Volatility and band-contact validation. |
| Stochastic Confirmation | 8 / 3 / 3 | Momentum-extreme validation. |
| Body Size ATR Multiplier | 0.5 | Filters insufficiently large candle bodies for relevant pattern rules. |
| Alerts | Sound / Email | Notification options for newly detected setups. |
Who Is PhantomII Designed For?
- Price-action traders who want automatic recognition of classic candlestick formations.
- Discretionary traders who want a second layer of confirmation before evaluating a setup.
- System developers who want to observe how specific patterns behave on different symbols and timeframes.
- Risk-focused traders who want immediate SL/TP distance and excursion statistics directly on the chart.
- cTrader users who prefer a visual, configurable tool rather than a fully automated trading robot.
Important: Indicator, Not Trading Robot
Quantina PhantomII - Product Summary
Quantina PhantomII Candlestick Pattern Indicator – Advanced Filter combines real-time candlestick recognition, configurable technical validation, dynamic risk/reward visualisation and rolling statistical analysis into one professional cTrader indicator.
It is designed to help traders move beyond simple visual pattern spotting and evaluate setups with more structure, context and measurable historical behaviour.
The result is a flexible analytical tool for chart study, signal filtering, discretionary decision support and pattern-performance research across supported cTrader markets and timeframes.
Risk Warning: Trading leveraged products involves significant risk and may not be suitable for all investors. This software is provided for analytical and educational purposes and does not constitute investment advice, a recommendation or a guarantee of results. Always test settings carefully before using them in live-market decision making.


Reviews
There are no reviews yet.