
Original price was: £149.00.£90.00Current price is: £90.00.
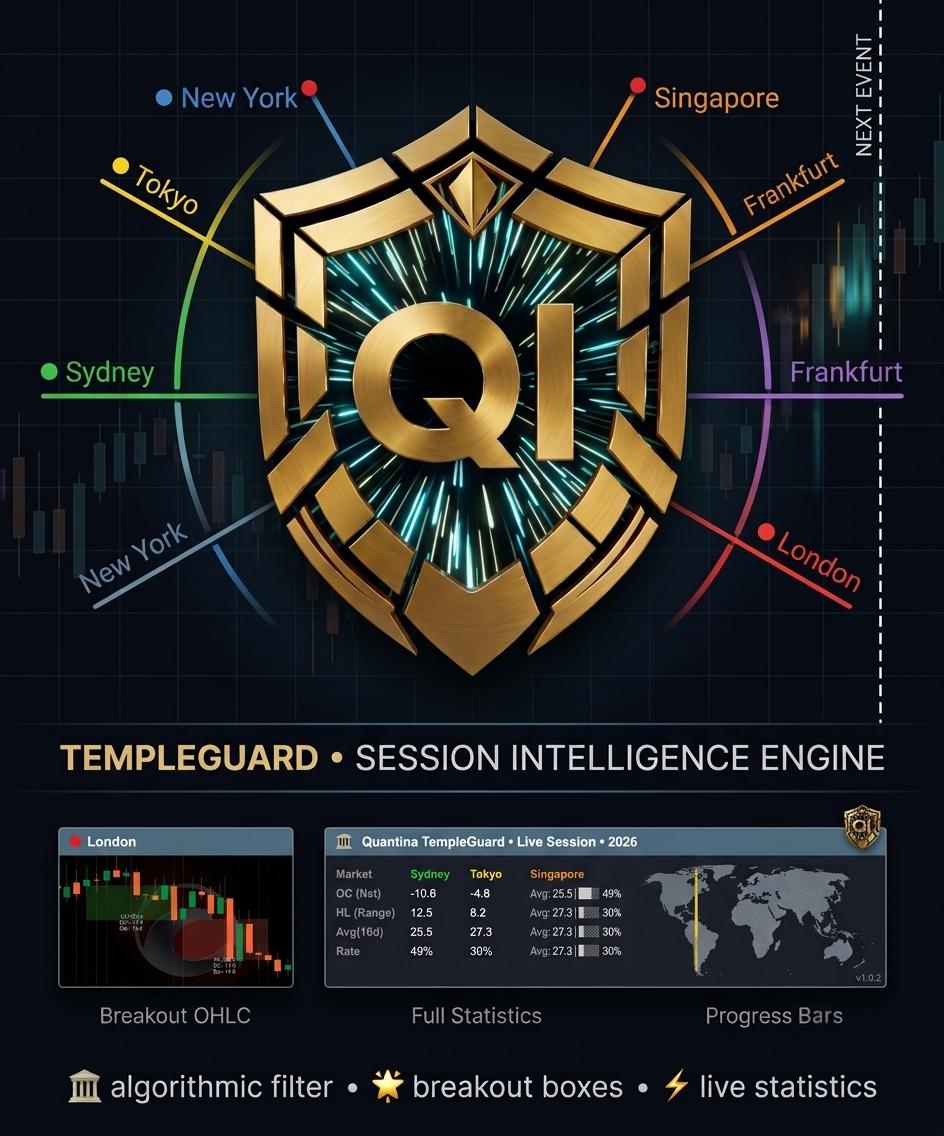
Quantina TempleGuard transforms the invisible institutional transitions of the trading day into structured, measurable market intelligence. It draws time‑boxed areas on your chart to show when major sessions are active, calculates descriptive statistics about each session, tracks how much of its typical range has been consumed, and provides a unified panel for at‑a‑glance context. For algorithmic developers, TempleGuard exposes a high‑level interface for filtering trades by session and by exhaustion conditions without exposing proprietary internals.
Quantina TempleGuard
Professional Market Session Intelligence Framework
Version 1.0.2 — June 2026
Developed by Quantina Ltd., Quantina Intelligence Research Lab.
About this document
This manual describes the operation, features, best‑practices and legal terms of the Quantina TempleGuard indicator. The TempleGuard is a professional market session visualiser and statistics engine designed for the cTrader platform. It transforms the invisible institutional transition points of the trading day into clearly defined boundaries, statistical panels and actionable context for manual traders and algorithmic strategies.
The information in this manual is intended for educational purposes only. It does not constitute investment advice, and it does not guarantee profitability. Use at your own risk. See the Risk Disclosure and Legal Notice sections for further details.
Legal Notice and Compliance
Copyright and Intellectual Property
© 2013–2026 Quantina Ltd. All rights reserved.
“TempleGuard,” “Quantina” and “Quantina Intelligence Research Lab.” are trademarks and intellectual property of Quantina Ltd. No part of this publication may be reproduced, distributed or modified without the prior written permission of the copyright holder.
All source code, algorithms, designs, icons, images and the documentation itself are protected under international copyright law. Unauthorised use, reproduction or dissemination is strictly prohibited.
Company information
- Responsible Company: Quantina Ltd.
- Department: Quantina Intelligence Research Lab.
- Registered Office: 41 Skylines Business Village, Canary Wharf, London, United Kingdom
- Website: quantina.co.uk
- Support: info@quantina.co.uk
Licensing model
Quantina TempleGuard is provided strictly on a licence basis. When you obtain a copy of this indicator you are not purchasing the software itself or any intellectual property in it. Instead, you are granted a limited, non‑exclusive, non‑transferable right to use the software for a specified period of time in accordance with the terms of the End‑User Licence Agreement (EULA).
The software remains the sole property of Quantina Ltd., and no rights are granted to copy, modify, reverse‑engineer, rent, sell, sub‑licence or otherwise distribute it. This rental‑style model has been consistently applied across all Quantina products: users pay for access and support; they do not acquire ownership of the underlying code or intellectual property【421048547653464†L82-L100】. Maintaining control over distribution allows Quantina to protect its proprietary algorithms and to provide timely updates and support.
FCA and UK regulatory context
TempleGuard is a market analysis tool that provides visualisation and statistics; it does not execute trades on behalf of the user, does not manage funds, and does not constitute a regulated investment service. As such, it does not require authorisation by the UK Financial Conduct Authority (FCA). It is the user’s responsibility to ensure that their use of TempleGuard complies with local regulations and with the policies of their broker or prop firm. Nothing in this manual should be construed as legal or financial advice.
Risk disclosure
Trading leveraged financial products such as forex, CFDs or futures involves substantial risk. Past performance is not indicative of future results. The statistical outputs and session analysis provided by TempleGuard are descriptive, not predictive【421048547653464†L82-L100】. Markets can move beyond historical averages and break technical structures without warning. Users are solely responsible for their trading decisions, including but not limited to position sizing, stop losses and capital allocation. Only trade with capital you can afford to lose.
No financial advice
TempleGuard is neither an investment advisor nor a broker. The software, its outputs and this manual are provided for informational and educational purposes only. Quantina Ltd. does not provide personalised financial advice. Always consult a qualified professional before making trading decisions.
Table of Contents
- Introduction
- Market Session Theory
- Live Statistics Panel
- Session Rendering and OHLC Boxes
- Trading Methodology
- Next Event Marker
- Settings and Customisation
- Developer Integration (High‑Level)
- Troubleshooting and Best Practices
- Conclusion
Introduction
Modern financial markets are global. Every trading day begins when the first institutional desks in Sydney open, gathers pace through Tokyo and Singapore, accelerates as Frankfurt and London come online, and reaches peak liquidity when New York joins. These regional sessions exhibit distinctive volatility patterns, spreads and order‑flow characteristics. Identifying and quantifying these patterns has traditionally required a combination of experience, manual chart marking and statistical analysis.
Quantina TempleGuard transforms the invisible institutional transitions of the trading day into structured, measurable market intelligence. It draws time‑boxed areas on your chart to show when major sessions are active, calculates descriptive statistics about each session, tracks how much of its typical range has been consumed, and provides a unified panel for at‑a‑glance context. For algorithmic developers, TempleGuard exposes a high‑level interface for filtering trades by session and by exhaustion conditions without exposing proprietary internals.
Unlike simple session indicators, TempleGuard also computes adaptive statistics such as the session Completion Rate and Average Candle Size, and includes a Next Event Marker to help avoid trades during institutional handover periods. These features allow both discretionary traders and cBot developers to calibrate their strategies to real‑time market dynamics rather than generic time blocks.
Market Session Theory
Primary sessions and their characteristics
TempleGuard tracks six primary market sessions. Each session has a default UTC time span and a colour. You can customise both the times and colours to match your broker’s time zone or personal preferences. For sessions that cross midnight (e.g. Sydney), TempleGuard handles the boundary seamlessly; you will always see a continuous box even when a session starts on one calendar day and finishes on the next.
| Session | Default Hours (UTC) | Typical Characteristics |
|---|---|---|
| Sydney | 22:00–07:00 | Opening of the global trading day; often lower volatility and wider spreads as liquidity builds. |
| Tokyo | 23:00–08:00 | Core Asian liquidity; driven by institutional order flow from central banks and export‑oriented corporations. |
| Singapore | 23:00–08:00 | Secondary Asian hub; overlaps with Tokyo and consolidates regional volume. |
| Frankfurt | 07:00–16:00 | First European session; often sets the early directional bias ahead of London. |
| London | 08:00–17:00 | Highest European volume; characterised by momentum bursts and tight spreads. |
| New York | 13:00–22:00 | High‑volatility session; overlaps with London, creating the most liquid period of the day. |
These times should be interpreted relative to UTC. If your broker charts are in another time zone, adjust the start and end times accordingly in the TempleGuard settings (see Settings).
Cross‑midnight handling
Some sessions start before midnight and end after (Sydney: 22:00–07:00 UTC). Rather than splitting the session into two boxes across the midnight divider, TempleGuard creates a unified structure that carries over into the next calendar day. The live statistics panel aggregates data across the entire session, avoiding artificial discontinuities at midnight. If you use cBots, you can rely on consistent session identifiers irrespective of date boundaries.
Visual hierarchy
In markets with overlapping sessions, it is essential to avoid visual clutter. TempleGuard layers sessions on top of each other using a render level hierarchy. Lower‑level sessions (e.g. Sydney) are drawn first; higher‑level sessions (e.g. London, New York) are drawn on top. You can adjust the render levels in the settings if you prefer a different stacking order.
Session interplay and overlaps
While each session has a nominal start and end time, the real market does not reset at fixed boundaries. Activity often bleeds across sessions, creating periods of overlap where liquidity and volatility can increase dramatically. The most important overlap is between London and New York, roughly 13:00–17:00 UTC, where both major financial centres are active simultaneously. This window typically produces the day’s largest moves and requires robust risk management.
Other overlaps can also generate opportunities or noise. The tail end of the Asian sessions (Tokyo/Singapore) meets the European open, sometimes causing false spikes as liquidity transitions from east to west. TempleGuard’s layered session boxes make these overlaps obvious so you can adapt your strategy – for example, waiting for a breakout during the London open or reducing exposure when the Asian session is winding down.
The following screenshot shows multiple sessions active on the same chart and highlights how TempleGuard visually separates them while still allowing you to see price interaction across zones:

Live Statistics Panel
TempleGuard provides two formats for viewing session statistics: Full and Compact. Both panels update in real time, and you can drag them anywhere on your chart or minimise them when not needed.

Full panel metrics
The full panel displays the following metrics for each active or recently closed session:
- Net Change (OC) – the directional displacement of the session from its opening price to its current price. Positive values suggest a bullish bias, negative values bearish. The calculation uses the symbol’s pip size; you see the result in pips rather than raw price.
- High–Low Range (HL) – the total vertical range between the highest high and the lowest low within the session. This measures volatility rather than direction.
- Average Candle Size (Avg) – the average trading range of the 1‑hour bars within the session so far. This metric gives you an indication of the session’s ‘stride’ or micro‑volatility.
- Completion Rate (Rate %) – the ratio of the current session range to its historical average over the past N days, expressed as a percentage. A value near 100 % suggests that the session has already covered most of its statistically expected range. A rate above 100 % signals potential exhaustion.
In addition to the numeric values, the panel shows a colour‑coded progress bar representing the completion rate. The bar gradually fills from left to right; it turns red when the rate exceeds 100 %, warning you of an overextended session.
Compact panel
If you prefer a more minimalist view, enable the Compact Panel. It displays only the most essential metrics (Net Change, HL Range and Completion Rate) in a single row per session, saving screen space. Use the compact mode when you run multiple indicators or when screen space is limited.
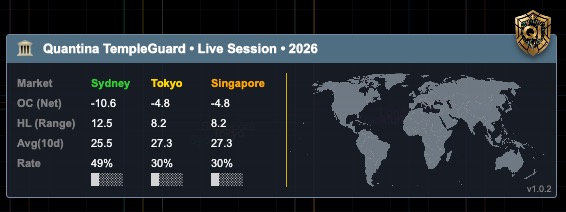
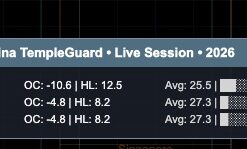
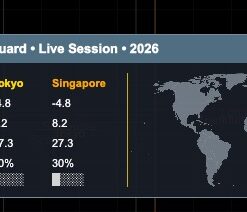
Multi‑session overview
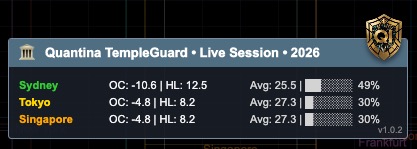
For a quick snapshot of several sessions at once, TempleGuard’s panel can display multiple rows summarising the most recently closed sessions. The example below shows statistics for Sydney, Tokyo and Singapore. Notice how the Net Change, HL Range, Average and Completion Rate provide an at‑a‑glance comparison of the sessions’ behaviour:

Session Rendering and OHLC Boxes
Session boxes and trend lines
TempleGuard draws semi‑transparent boxes on your chart that correspond to each session’s active period. The boxes are colour‑coded according to the session and include thin trend lines at the top and bottom to mark the session’s high and low levels. The opacity of the boxes can be adjusted or disabled altogether in the settings.
OHLC breakout boxes
For selected sessions (typically Tokyo and Singapore), you can enable OHLC breakout boxes. After a session closes, TempleGuard draws a rectangular box that spans the session’s high and low. This box is often referred to as an accumulation zone, reflecting the tendency for the Asian sessions to trade in a relatively tight range. Traders often monitor subsequent sessions to see if price breaks out of this zone.
The box includes a centre line representing the midpoint between the high and low. This line can serve as a stop‑loss anchor when trading breakouts. A typical breakout approach is to enter a trade when price closes above the high or below the low of the box during the first part of the London session. The box’s average candle size can be used to project potential take‑profit targets (see Trading Methodology).

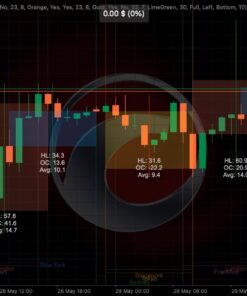
Visual customisation
Use the settings panel to specify which sessions draw boxes, the box colours and transparency, whether to show centre lines, and whether to display the High/Low labels on the chart. You can also hide individual sessions entirely if they are not relevant to your strategy.
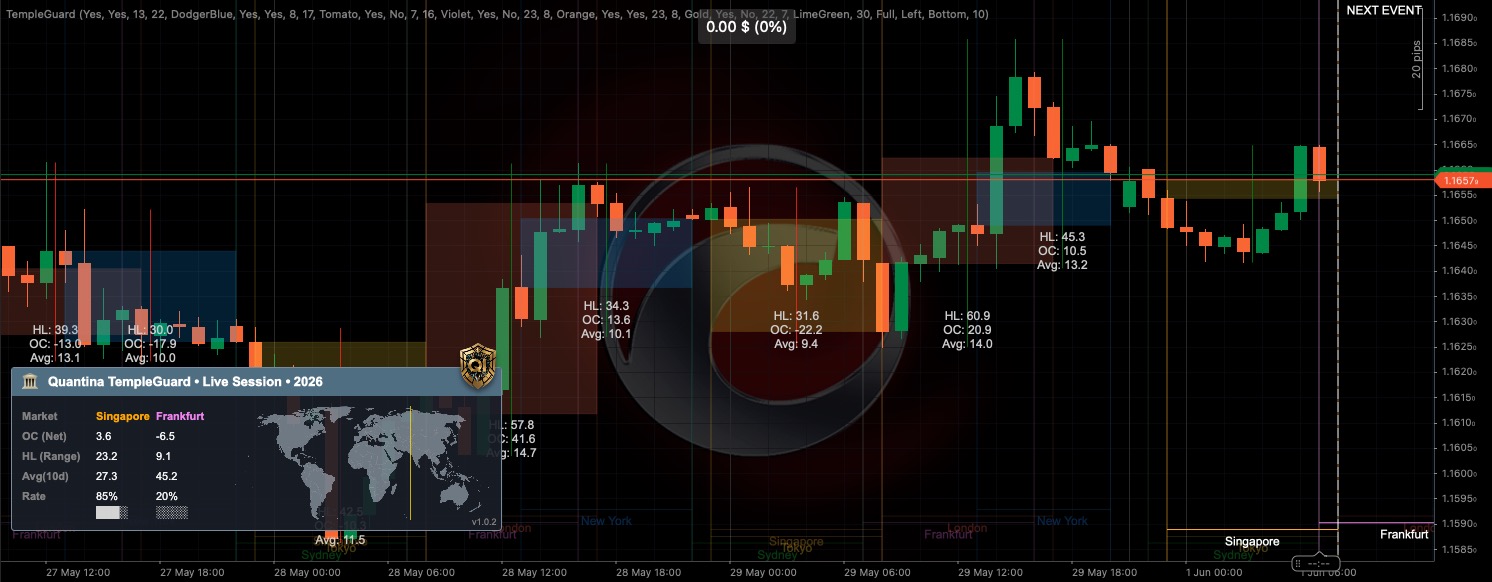
To illustrate how TempleGuard draws and stacks session boxes, the screenshot below shows a chart where the Frankfurt, London and New York sessions have created overlapping regions. The transparency and colour coding allow you to discern each session’s range while still seeing the price candles underneath:
Trading Methodology
TempleGuard is a contextual tool, not a black‑box signal generator. Its statistics help you decide when conditions may favour certain strategies and when caution is warranted. This section outlines common approaches that traders employ with TempleGuard.
London breakout framework
During the Asian sessions, major currency pairs often consolidate within a relatively narrow range. When Europe opens, institutional liquidity surges and price frequently breaks out of that overnight range to establish the day’s trend. TempleGuard helps you visualise this phenomenon using the OHLC breakout box from Tokyo/Singapore.
Setup:
- Enable OHLC boxes for Tokyo and Singapore sessions.
- Wait for the Asian sessions to close. The box draws automatically on your chart and displays the session’s high, low and midpoint.
- During the first two hours of the London session, monitor the price relative to the Asian box. A bullish bias emerges when a candle closes completely above the box’s high; a bearish bias emerges when a candle closes completely below the box’s low.
- Place your stop loss at or near the midpoint of the box. Set a take‑profit level equal to approximately 1.5 times the Average Candle Size of the closed Asian sessions. For example, if the average size is 12 pips, target around 18 pips.
Rationale: The breakout occurs when European liquidity pushes price out of the Asian range. Using the average Asian candle size as a target accounts for recent volatility while preventing unrealistic expectations.
Remember that breakouts are not guaranteed; false breakouts can occur. Always manage risk appropriately and consider skipping trades when major economic news is scheduled during the London open.
New York mean‑reversion framework
Later in the day, especially during the latter half of the New York session, market momentum often slows and overextended trends may retrace toward fair value. The Completion Rate can help identify potential exhaustion.
Setup:
- Ensure that the session statistics panel is visible and that the Completion Rate calculation uses a reasonable lookback period (the default is 10 days).
- During the active New York session, observe when the Completion Rate reaches or exceeds 100 % while the Net Change shows a strong positive or negative bias.
- Wait for a reversal candlestick pattern on a lower time frame (e.g. a shooting star, hammer or engulfing pattern on a 5‑ or 15‑minute chart).
- Enter a position counter to the prevailing trend (short if price has been rallying and rate is high; long if price has been falling and rate is high).
- Set a tight stop loss 5–10 pips beyond the session’s extreme. Target a retracement of roughly 50 % of the Net Change, aiming for the midpoint between the session’s open and its high/low.
Rationale: When a session has exhausted most of its typical range, large participants may take profits or hedge exposures, causing price to drift back toward equilibrium. The Completion Rate serves as a statistical overextension warning, while candlestick patterns provide immediate evidence of reversal attempts.
Institutional handover filter
TempleGuard includes a Next Event Marker (see next section) that shows when the next session opens or closes. It is strongly recommended to avoid opening new positions within 20 minutes of a session transition. Institutional desks re‑balance positions at those times, causing whipsaws and erratic volume spikes. Patience during these windows can improve trade quality.
False breakouts and news events
Not every breakout persists. Sometimes price briefly breaches the Asian range high or low only to reverse sharply – a false breakout. To reduce the likelihood of being caught in one:
- Wait for a candle to close firmly outside the Asian box rather than entering on an intra‑candle spike.
- Consider entering on a retest of the breakout level instead of the first break; this requires patience but may provide a better risk–reward profile.
- Be aware of scheduled economic news releases. High‑impact news (interest‑rate decisions, unemployment data, CPI, etc.) can cause erratic price moves that distort the usual session dynamics. During such times, statistics like Completion Rate may be less reliable, and standing aside can be the prudent choice.
Cross‑asset and time‑zone considerations
Although TempleGuard was designed with forex markets in mind, its session boundaries can be useful when trading indices, commodities and even cryptocurrencies. Different instruments may respond differently to each session – for example, gold tends to move with the US session, while JPY pairs are more active during the Asian hours.
Always adjust session times to match your broker’s server time and the market you are trading. Some brokers use servers in UTC, others in GMT+2 or +3. TempleGuard allows you to set custom start and end times for each session so that the boxes align correctly with the price data on your chart.
Next Event Marker
The trading day comprises a sequence of overlapping sessions. Major transitions often produce sudden volatility as liquidity shifts from one region to another. To help you avoid these risky moments, TempleGuard draws a white dashed vertical line labelled “Next Event.” This line counts down to the upcoming session open or close.
Invalidation rule: If the Next Event marker is less than 20 minutes away, you should refrain from entering new trades. Existing positions may be managed, but new entries carry elevated risk. The marker resets after each session event and provides continuous awareness of the market’s temporal structure.
The screenshot below shows the Next Event marker on the far right of the chart, warning of an imminent session transition. Notice how price action ahead of the marker can become choppy as liquidity dries up and institutions shift their books:
Settings and Customisation
TempleGuard provides extensive customisation options. The settings are grouped into logical sections for ease of use. Below is a high‑level overview; refer to your trading platform’s properties dialog for the exact field names and default values.
Session configuration
- Enable Session – toggles whether a particular session is drawn.
- Session Colour – choose the colour for each session box and trend line.
- Session Start/End Time – adjust session times relative to your broker’s time zone.
- Render Level – set the stacking order for sessions; higher numbers draw on top.
- Cross‑Session Linking – link related sessions (e.g. Tokyo and Singapore) for combined OHLC boxes.
Box and line settings
- Draw OHLC Box – enable or disable the post‑session accumulation box for selected sessions.
- Box Transparency – adjust opacity for better visibility.
- Show Centre Line – toggles display of the midpoint line inside each box.
- Show Labels – display or hide the session high/low values directly on the chart.
Statistics settings
- Display Panel Mode – choose between Full, Compact or Off.
- Average Range Period (Days) – set the lookback period used for calculating historical averages and completion rates.
- Enable Completion Rate – toggle the completion ratio calculation and progress bar.
Next Event
- Show Next Event Marker – enable or disable the vertical dashed line indicating session handovers.
- Lead Time (Minutes) – set how far in advance the marker appears. The default is 20 minutes.
Miscellaneous
- Panel Position – drag the panel to any part of your chart.
- Theme Support – TempleGuard automatically adapts to light or dark chart themes; adjust colours as needed for optimal contrast.
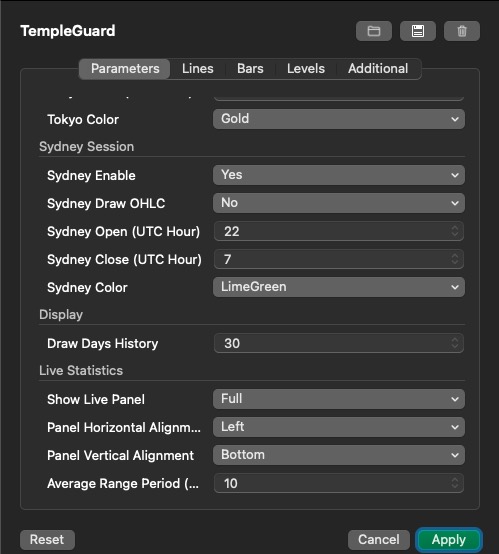
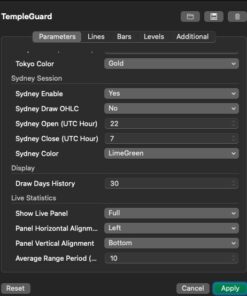
TempleGuard’s settings are accessible via your trading platform’s indicator parameters dialog. Options are grouped into tabs (Parameters, Lines, Bars, Levels, Additional) for clarity. The screenshot below illustrates a typical configuration screen, where you can enable or disable sessions, assign colours, choose panel placement, and set the average range period:

Developer Integration (High Level)
TempleGuard can serve as the analytics backend for custom cBots. This enables automated strategies to adjust their behaviour based on session activity and statistical conditions without re‑implementing complex time‑zone and overlap logic.
Important: To protect Quantina’s intellectual property, the public API exposes only high‑level session data and signals. The underlying implementation details remain proprietary.
Session data
For each session, the API exposes a SessionStats object containing read‑only properties such as:
- Session name and identifier
- Current session status (active or closed)
- Opening price, high, low and closing price
- Net Change and High–Low Range (in pips)
- Average Candle Size (in pips)
- Completion Rate (0–100 + %)
Signal provider
The API includes a SessionFilterSignalProvider that can be plugged into your cBot. You define “required” and “restricted” sessions; the provider will allow or block trade execution based on whether the current bar falls within those sessions. You can also query the completion rate and other statistics for dynamic risk sizing or strategy switching.
Example usage
This pseudocode demonstrates how a cBot might interact with TempleGuard at a high level:
// Pseudo‑code; not complete implementation

// Initialize TempleGuard indicator and signal provider
var templeGuard = Indicators.GetIndicator<TempleGuard>(averageDays: 30, panelMode: Full);
var signalProvider = new SessionFilterSignalProvider();
signalProvider.Initialize(Bars, null, new Dictionary<string, object>
{
    {"TempleGuard", templeGuard},
    {"RequiredSessions", MarketSession.London | MarketSession.NewYork},
    {"RestrictedSessions", MarketSession.Sydney | MarketSession.Tokyo}
});

// On each bar, check whether trading is allowed
var result = signalProvider.GetSignal(Bars.Count - 1);
if (!result.IsValidLocal)
{
    // Cancel trading if session rules are violated
    return;
}

// Retrieve session statistics for further logic
var londonStats = signalProvider.GetActiveSessionData(MarketSession.London);
if (londonStats.CompletionRate < 80 && londonStats.NetChangePips > 10)
{
    // Example: open a position only if completion rate is low and trend is strong
}
For full details, please refer to the developer SDK and API reference provided separately under a non‑disclosure agreement.
Licensing and usage restrictions
Developers integrating TempleGuard into automated strategies must adhere to the EULA. The API is provided solely for use with a valid TempleGuard licence; any attempt to circumvent licence checks, redistribute the software or reverse‑engineer the underlying algorithms is strictly prohibited. The SessionStats and SignalProvider classes expose only high‑level data and do not reveal proprietary computations. If you require extended access or custom integrations, please contact Quantina Ltd. for a commercial licensing agreement.
Troubleshooting and Best Practices
- No boxes visible: Check that the session is enabled and that its start and end times are correct for your broker’s server time. Also verify that the box’s opacity is not set to zero.
- Inconsistent statistics: If values appear erratic, ensure that your data feed provides continuous price history across the entire session. Gaps or weekend candles can distort averages.
- High completion rate but no reversal: A completion rate above 100 % is a warning, not a guarantee of reversal. Always wait for price action confirmation before entering counter‑trend trades.
- Panel covering candles: You can drag the statistics panel to a convenient location or switch to compact mode.
- Strategy alignment: TempleGuard is most effective when combined with sound trading principles such as trend identification, support/resistance analysis, and prudent risk management. It should not be used in isolation.
Conclusion
TempleGuard is a comprehensive market session intelligence framework. By combining elegant visualisation with real‑time statistics, it provides traders and algorithmic systems with contextual awareness of when the market is likely to expand, exhaust or transition. Its rental‑based licencing model safeguards proprietary algorithms while ensuring that users always run the most up‑to‑date version.
We encourage you to explore TempleGuard’s capabilities, customise it to your trading style and integrate it responsibly into your workflow. For support, updates and licensing enquiries, please contact info@quantina.co.uk or visit quantina.co.uk.
Developed by Quantina Ltd., Quantina Intelligence Research Lab.
Lead Software Architect & Principal Research Engineer: Balazs Kulcsar
© 2026 Quantina Ltd. All rights reserved.
Be the first to review “Quantina TempleGuard Session Indicator”
Related products

cTrader Application
Reviews
There are no reviews yet.