Insider Trading Tips, Other
What Stock Should I buy in July

Jul
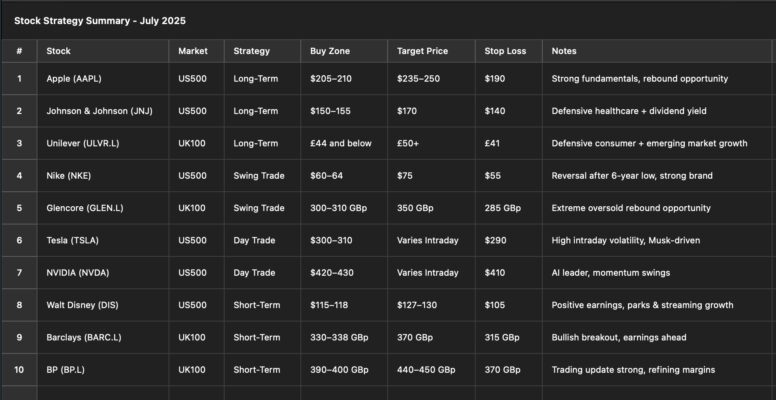
Market Report: Stock Picks by Trading Style (US S&P 500 & UK FTSE 100)
Overview: As of mid-July 2025, equity markets present a mixed landscape. The US S&P 500’s tech giants have pulled back from late-2024 highs (e.g. Apple ~18% below its record) , while the UK’s FTSE 100 hovers near record levels yet still offers undervalued opportunities. Below, we provide specific stock recommendations categorized by trading style – Long-Term Investing, Swing Trading, Day Trading, and Short-Term Investing (≈10% return) – complete with ticker symbols, entry/exit targets, technical analysis (RSI, MACD, support/resistance), fundamental highlights (P/E, growth, debt), recent news, and analyst ratings. Each category includes both US (S&P 500) and UK (FTSE 100) stocks, ensuring a diversified outlook.
| Stock | Market | Strategy | Buy Zone | Target Price | Stop Loss | Notes |
| Apple (AAPL) | US500 | Long-Term | $205‚-210 | $235‚-250 | $190 | Strong fundamentals, rebound opportunity |
| Johnson & Johnson (JNJ) | US500 | Long-Term | $150‚-155 | $170 | $140 | Defensive healthcare + dividend yield |
| Unilever (ULVR.L) | UK100 | Long-Term | £44 and below | £50+ | £41 | Defensive consumer + emerging market growth |
| Nike (NKE) | US500 | Swing Trade | $60‚-64 | $75 | $55 | Reversal after 6-year low, strong brand |
| Glencore (GLEN.L) | UK100 | Swing Trade | 300‚-310 GBp | 350 GBp | 285 GBp | Extreme oversold rebound opportunity |
| Tesla (TSLA) | US500 | Day Trade | $300‚-310 | Varies Intraday | $290 | High intraday volatility, Musk-driven |
| NVIDIA (NVDA) | US500 | Day Trade | $420‚-430 | Varies Intraday | $410 | AI leader, momentum swings |
| Walt Disney (DIS) | US500 | Short-Term | $115‚-118 | $127‚-130 | $105 | Positive earnings, parks & streaming growth |
| Barclays (BARC.L) | UK100 | Short-Term | 330‚-338 GBp | 370 GBp | 315 GBp | Bullish breakout, earnings ahead |
| BP (BP.L) | UK100 | Short-Term | 390‚-400 GBp | 440‚-450 GBp | 370 GBp | Trading update strong, refining margins |
Long-Term Investing (Low to Medium Risk)
For low-to-medium risk long-term investments, we focus on blue-chip companies with solid fundamentals, durable earnings, and stable growth. These picks balance defensive attributes (strong cash flows, healthy dividends, reasonable debt) with growth catalysts, suitable for a buy-and-hold strategy.
Apple (AAPL) – U.S. Tech Titan for Steady Growth
Figure: Apple (AAPL) 2025 YTD price trend, showing a pullback from late-2024 highs and stabilization above long-term support.
Overview: Apple remains a cornerstone long-term holding, combining a robust balance sheet with innovative growth avenues. After reaching an all-time high of ~$258 in late 2024 , AAPL’s stock has pulled back (~15% YTD decline) amid broader tech volatility , presenting an attractive entry for patient investors.
Fundamentals: Apple’s services and ecosystem are driving consistent revenue growth despite near-term hardware headwinds. In its latest earnings, Apple guided for ~$89.1 billion in next-quarter revenue with EPS $1.42 . Its massive cash reserves ($73 billion) and ongoing buybacks underscore financial strength . Apple trades at ~26× forward earnings – a premium to the S&P 500’s ~23× – reflecting its quality, though investors should note this elevated P/E. Debt levels are manageable relative to cash flow, and the company maintains a modest dividend (~0.5% yield). Recent analyst consensus sees 12% upside in Apple (average target ~$236) , with bullish outlooks citing new product catalysts (augmented-reality devices, AI enhancements in iOS) and growth in high-margin services . For example, Raymond James recently reiterated an “Outperform” with a $230 target .
Technical Analysis: After its correction, Apple’s RSI is ~60 (neutral) – cooled off from earlier overbought levels . The MACD has flattened, reflecting the recent consolidation . Key support lies around the $200 level (a price floor AAPL tested during the June sell-off) – a zone where long-term buyers have previously stepped in. Overhead, there is resistancearound $235–$240, near the average analyst target and a level AAPL approached in Q1 2025. A break above $240 would signal renewed upside momentum.
Recent Developments: Market sentiment is improving as tech fears abate – Apple’s stock decline in H1 2025 (about 25% off the highs) has tempered valuations . Notably, NVIDIA’s surge to a $4 trillion market cap in 2025 boosted tech sector confidence , indirectly supporting Apple’s stock. However, Apple faces some macro headwinds: e.g. potential tariffs (U.S.–China trade tensions) and a delay in certain AI-driven product features . Apple’s management continues to invest heavily in R&D for future innovations (from AR/VR to automotive), which bodes well for long-term growth.
Analyst & Investor Sentiment: Wall Street remains broadly bullish – 17 “Buy” ratings vs 6 “Hold” – reflecting Apple’s resilience . That said, some warn of slower growth ahead, evidenced by a slight premium valuation. Apple’s forward P/E (~26) is above its 5-year average, so long-term investors should expect moderate, not explosive, returnsfrom here. Nevertheless, its exceptional ROE, brand loyalty, and ecosystem lock-in make it a dependable core holding.
-
Buy Zone: ~$205–210 (on dips near support)
-
Price Target (12-mo): ~$235 (consensus) ; longer-term $250+ if growth catalysts materialize
-
Technical Outlook: Neutral-Trending. Support ~$200 ; resistance ~$235. RSI mid-60s (neutral) . A sustained break above $240 would be a bullish signal for adding.
-
Fundamental Metrics: P/E ~26, PEG ~2.1 , Cash $70B+, Debt ~$110B (well-covered by cash flow). Dividend yield 0.5%.
-
Recent News: Strong App Store and services sales offsetting hardware softness ; Raymond James price target $230 . Investors should monitor upcoming product launches (e.g. AR glasses) and any hints of consumer demand shifts in the next earnings call.
Johnson & Johnson (JNJ) – Healthcare Stability and Dividend Income
Overview: Johnson & Johnson is a low-beta defensive stock ideal for long-term investors seeking stability and income. The healthcare conglomerate (pharma, medical devices) has a AAA credit rating and a track record of steady earnings. JNJ shares trade around $155–160, roughly flat YTD after recovering from a litigation-driven dip last year. This price is just under its 200-day moving average (~$156) .
Fundamentals: JNJ’s valuation is attractive relative to the market. Its forward P/E is ~14.5, below the healthcare sector average (~17) and JNJ’s own 5-year mean – signaling a margin of safety. The stock offers a dividend yield ~3.3%, backed by a safe ~55% payout ratio . JNJ boasts a high ROE (~29%) reflecting efficient operations . Revenue growth is modest (~2–3% annually) , but the company’s diversified product portfolio (from immunology drugs to surgical tools) and heavy R&D investment ($14B+ annually) support long-term growth. Notably, newer drugs (Carvykti CAR-T therapy, Spravato, Tremfya) are seeing double-digit sales growth , offsetting patent expirations (e.g. Stelara LOE) – a positive sign for sustaining earnings. Debt levels are moderate (debt-to-equity ~0.7) and JNJ maintains large cash reserves, partly bolstered by the recent Kenvue consumer health spinoff.
Litigation: The overhang from talc-related lawsuits persists (potential liabilities ~$10B) , but JNJ has set aside reserves and many analysts believe this risk is largely priced in . A recent bankruptcy maneuver for the talc unit could lead to a global settlement, removing a long-standing uncertainty.
Technical Analysis: JNJ’s stock is trading in a stable range. Support sits around the low-$150s (it bottomed near $150 during Q1 2025’s sell-off). Resistance is around $165–170 (its 52-week high ~$167) . The RSI ~58 is neither overbought nor oversold , and the MACD is flat – consistent with the stock’s low volatility (beta ~0.4) . This suggests JNJ may continue to oscillate mildly with earnings events and sector news. Long-term uptrend support from pandemic lows remains intact, but slope is gentle.
Analyst & Market View: Analysts have a hold-heavy stance: 11 Buy, 13 Hold, 0 Sell . The average target is ~$169, implying ~9% upside plus dividends – a solid expected return for a low-risk profile. JNJ’s strong dividend history (60+ years of increases) makes it a core holding for income investors. Upcoming catalysts include its Q2 earnings (watch for updates on drug pipelines like cell therapy, and medtech margins) . JNJ also carries a Zacks Rank #2 (Buy) with recent upward earnings revisions , reflecting optimism that new drugs and cost controls can drive a slight EPS beat.
-
Buy Zone: ~$150–155 (accumulate on any dips near 52-week lows)
-
Price Target (12-18 mo): $170 (median street target) , with total return ~12% including dividends.
-
Technical Outlook: Stable/Defensive. Support ~$150; Resistance ~$165. Low volatility (β ~0.41) means large swings are unlikely – an ideal “sleep-well” stock.
-
Fundamental Highlights: Forward P/E ~14 (discount to peers), Dividend 3.3% (well-covered), EPS growth forecast ~5–7%/yr. Talc litigation risk exists but is largely accounted for . Strong balance sheet (one of two US companies with AAA rating).
-
Recent News: JNJ is focusing on its pharmaceutical innovations – e.g. Carvykti (cell therapy) sales +120% YoY – and expanding MedTech (acquired Abiomed in cardiac devices). Any resolution of the talc cases or faster drug growth could catalyze the stock.
Unilever PLC (ULVR.L / UL) – UK Consumer Staples Leader for Defense and Yield
Overview: Unilever is a FTSE 100 stalwart and one of the world’s largest consumer goods companies (foods, personal care, cleaning products). It’s a classic low-risk, long-term play, ideal for investors seeking dependable dividends and global exposure. The stock trades around £47.20 (4719 GBp) on the LSE , roughly mid-way in its 1-year range (£42.24 – £50.34) . Year-to-date performance is flat, underperforming the broader FTSE 100 (which hit record highs) as Unilever navigates higher input costs and CEO transition.
Fundamentals: Unilever’s appeal lies in its resilient earnings and cash flow across economic cycles. Trailing P/E is ~20.3 , which is lower than the overall market average – indicating the stock is modestly valued relative to peers. Revenue growth is modest (1–5% range; last reported +1.6% YoY) due to the mature nature of its brands, but the company compensates investors with efficiency and returns: ROE is a high ~29% , and annual free cash flow tops £6.3 billion . Unilever sports a 3.2% dividend yield , attracting income investors. Its dividend is well-established (payout ~75% of earnings) – a high payout, but supported by stable profits. Debt is moderate (Net Debt/EBITDA ~2×) and the company maintains a strong investment-grade credit rating.
Growth/Catalysts: While a defensive play, Unilever is not without growth opportunities. It’s focusing on higher-margin categories and emerging markets (which contribute over 50% of sales). Price increases have helped offset cost inflation recently. The new CEO (Hein Schumacher as of July 2023) is pursuing a strategy to reignite growth and streamline operations – including potential brand portfolio tweaks and greater investment in product innovation and marketing. Moreover, Unilever’s commitment to sustainability and strong ESG profile could bolster its appeal (and pricing power) over the long run .
Technical Analysis: Unilever’s shares have been range-bound. The stock currently sits just below its 50-day (≈£46.28) and 200-day (≈£46.80) moving averages , which converge around the £46–47 level – a region that could act as near-term resistance. Support appears around £45 (recent lows), with stronger support at ~£42 (the 52-week low) . The RSI ~49 is in the middle of the scale , indicating neither overbought nor oversold conditions. This neutral momentum suggests the stock will likely continue oscillating in its range absent a new catalyst. Long-term uptrend investors can accumulate when it’s at the lower end of the band.
Analyst & Market View: Analyst sentiment on Unilever is mixed: 9 Buys, 6 Holds, 3 Sells . The average price target ~£48.72 implies only ~3% upside – reflecting a cautious outlook (many analysts see the stock as fairly valued after its recent rebound). However, some bullish analysts argue Unilever’s defensive qualities deserve attention in uncertain markets; Morningstar, for instance, sees it as slightly undervalued. Key things to watch are margin trends (can Unilever improve margins as raw material inflation eases?) and emerging market growth.
-
Buy Zone: £44 and below (accumulate gradually for yield when the stock dips into the low-£40s, which has been a support area).
-
Price Target (1–2 yr): £50+ in a benign scenario (mid-single-digit % upside, plus ~3% annual dividend). Higher targets would require mid-single-digit sales growth, which is ambitious.
-
Technical Outlook: Neutral/Range-bound. Support ~£44; Resistance ~£48–49. A breakout above £50 (last year’s high) would signal a bullish trend change, while a drop under £42 could warn of further downside. RSI ~49 (neutral) – no strong momentum signals currently.
-
Fundamental Highlights: P/E ~20 , Forward P/E in mid-teens (as earnings are forecast to grow into 2025) . Dividend 3.2% , well-covered by cash flow. Low beta (~0.5) – less volatile than market. Constant currency sales growth expected ~3–5% (company guides 3–5% for FY25) . Challenges include cost pressures and competitive markets, but brand strength (Dove, Hellmann’s, etc.) provides pricing power.
-
Recent News: Unilever delivered improved margins in recent results (gross margin up +2.8 ppt) , but issued a cautious outlook that sent shares down ~7% on the report . The company reconfirmed its FY25 sales growth target of 3–5% . Investors are watching how Schumacher’s new strategic initiatives (possibly portfolio shake-ups or higher R&D spend) will translate into growth. For now, Unilever remains a steady dividend play in the consumer defensive sector .
Swing Trading Picks (Medium-Term Trades)
Swing trading focuses on profiting from medium-term price swings (holding days to weeks). The stocks below exhibit clear technical patterns or recent catalysts that swing traders can exploit – such as oversold bounces, trend channel trades, or reaction to news. We highlight one US and one UK stock that offer attractive risk-reward setups for a swing trade.
Nike (NKE) – Oversold Reversal in Progress (U.S.)
Figure: Nike (NKE) stock fell to a 6-year low (~$58) and is rebounding, with swing traders eyeing ~$75 as next resistance.
Setup: Nike’s stock has become a compelling swing trade candidate after a sharp 6-year low was hit this summer. The athletic apparel giant faced a slew of bad news – inventory gluts, China weakness – that drove its shares down to ~$58 in late June . This level coincided with long-term support (Nike hadn’t traded this low since 2019). Now, technicals point to a reversal: the stock has bounced ~20% off that low (trading ~$72–73 as of mid-July). Swing traders can aim to ride this momentum further, while managing risk tightly.
Technical Analysis: Several bullish technical signals emerged as Nike bottomed: The 14-day RSI dropped below 30 (oversold) in May, then rose back above 45 by late June – indicating fading bearish momentum . Trading volume spiked during the late-June selling climax (hinting at capitulation and institutional buying) . Nike then put in a reversal candlestick around $58. Since then, it’s been making higher highs and higher lows on the daily chart, confirming an uptrend. Key support now stands at ~$60 (the breakout zone and 20-day MA), with the major long-term support at $58(swing low) . On the upside, resistance is anticipated around $75 – a price zone that marks the bottom of a gap from March and aligns with the 200-day MA just above $74. Notably, Nike’s MACD has turned positive and its short-term moving averages have crossed up, supporting the bullish swing.
Fundamentals/Catalysts: From a fundamental perspective, Nike’s sell-off made its valuation attractive for a high-quality brand. At ~$60, Nike was ~19.8× trailing earnings – well below its 10-year peak multiples . Forward P/E is higher (~28×) due to an earnings dip, but that still implied ~27% upside to the street’s $78 price target . The pessimism was driven by a 15% revenue decline and 87% EPS drop expected in Q4 FY2025 . However, Nike’s recent earnings (reported June 26) beat expectations – the company delivered a surprise profit and unveiled a bold turnaround plan, which sent the stock jumping over +10% in a day . Positive catalysts include Nike’s $2 billion cost-cutting program (reducing overhead, improving supply chain) and early signs of inventory cleanup (inventories fell YoY for the first time in Q3) . Additionally, Nike’s push into higher-margin products (e.g. popular collaborations like the Jordan x Travis Scott line and Nike’s partnership with influencer brands) is expected to stabilize margins by late 2025 . Swing traders are also keen on seasonal strength: historically, Nike often rallies into back-to-school season (late summer) as sales pick up.
Swing Trade Plan: The risk-reward on Nike looks favorable here. Analysts’ bull case suggests a rally to ~$70–75 if Nike’s turnaround shows traction (e.g. an earnings beat or upbeat guidance), whereas the bear case sees downside to ~$55 if issues persist . Given Nike’s strong brand and the evidence of bottoming, the bias is to the upside.
-
Entry (Buy) Zone: $60–$64 on pullbacks. Nike is attractive on any dip near $60 (its breakout retest).
-
Profit Target: $75 area. This is the next major resistance and aligns with Nike’s consensus target (~$78) minus a small safety margin . It also represents ~+20% from a $62 entry, a solid swing gain.
-
Stop-Loss: ~$55. A stop just below $58 support (e.g. $55) limits downside to ~-$5 (-8%) . If Nike falls back to new lows, the bullish thesis invalidates.
-
Technical Signals: Bullish Swing. Oversold RSI has reversed higher ; MACD bullish crossover. Watch for continuation of higher lows. If volume expands on up-days, it confirms accumulation. A move above $75 could extend the swing to ~$80 (gap fill). Conversely, a fall under $58 would signal caution.
-
Recent News to Monitor: Nike’s Q4 FY25 earnings (late June) showed better margins and inventory control, sparking upgrades – e.g., analysts raised targets, calling the drop a “buying opportunity” . Look out for any updates on China sales and North America demand (a modest recovery there could fuel the stock higher) . Also, any broad market moves in consumer discretionary or signs of improving retail trends can strengthen Nike’s swing.
Glencore PLC (GLEN.L) – Commodity Giant at Extremes (U.K.)
Setup: Glencore, the Anglo-Swiss mining & commodities trading firm, offers a high-volatility swing trade opportunity. The stock has whipsawed between 230 GBp and 479 GBp in the past year , reflecting shifts in commodity prices and company-specific news. Recently, Glencore’s share price plunged to ~302 GBp (after a steep downtrend from ~400 in early 2025) amid falling copper output and fading trading profits. This drop sent technical indicators to extreme oversold levels – notably, the RSI hit 9.9, one of its lowest readings on record . Such an oversold condition often precedes a sharp mean-reversion swing. Indeed, Glencore has started to bounce off the ~£3.00 level in July. Swing traders eye further upside as the panic subsides.
Technical Analysis: Glencore’s chart in late June/early July shows a classic bottoming setup. The stock was trending down for months and then accelerated into a capitulation sell-off: heavy volume days in late June as it fell into the £2.90–3.00 zone. The Relative Strength Index dropped to ~10 , signaling deeply oversold conditions (anything below 30 is oversold; ~10 is extremely rare). Now, RSI has curled up as price stabilized above 300p, indicating momentum turning. There’s a bullish divergence visible – while price made a new low, RSI did not make a significantly lower low, hinting at weakening selling pressure. Support is clearly defined at ~290 GBp (recent low and multi-year support area). On the upside, initial resistance is around 335–340 GBp (prior support from April that could act as resistance now). Beyond that, the 200-day MA near ~336 GBp and the gap down level ~360 GBp are next resistance zones. The stock is still below its 200-day, but any rebound toward that average would be a sizable swing. Notably, analyst targets average ~384 GBp, suggesting the stock could recover toward the upper £3 range in time – aligning with swing trade upside. Technically, a close back above 340 would confirm a trend reversal. Until then, this is a counter-trend “oversold bounce” play.
Fundamentals/Catalysts: Glencore’s sell-off was driven by a combination of lower commodity prices (especially copper and coal) and company commentary. In early July, Glencore warned that its trading division profits for 2025 would likely be lower as market volatility normalizes (Glencore uniquely relies on trading revenue along with mining). Additionally, production reports showed copper output down 30% in Q1 , spooking investors about operational issues. However, the fundamental case for Glencore remains strong: it is a diversified resource player (copper, coal, zinc, nickel, etc.) benefiting from long-term trends like electrification (copper demand) while also returning lots of cash to shareholders. At ~305 GBp, Glencore’s valuation became notably cheap – analysts point out it was trading at <4× EV/EBITDA and offering a shareholder yield near 10% (dividends + buybacks) . The company has a robust balance sheet and is poised to profit if commodity prices rebound. Importantly, Glencore has been pursuing M&A (an attempt to merge with Teck Resources was a recent headline) and there’s speculation it could spin off or restructure its coal business, which could unlock value. Any positive news on these fronts could be a catalyst for a sharp rally. Also, China stimulus or improving macro data (China is a major commodity consumer) would likely lift Glencore and its peers.
Swing Trade Plan: Given the extreme oversold state and the fundamental cushion (high yield, low valuation), Glencore’s swing setup is to buy the bounce with a stop below the lows. The idea is that the downside is limited (~-5% if new lows) but upside could be +15–20% if it reverts to mean.
-
Entry (Buy) Zone: 300–310 GBp. This is near current levels; ideally enter on slight dips or consolidation days around £3.00. Ensure price is stabilizing (e.g. not free-falling) – recent action shows it is stabilizing above 300.
-
Profit Target: 350 GBp. This round-number target lies below the 200-day MA (~336) and within reach of filling the gap to ~360. It’s also where the stock traded in May. At 350, one would capture roughly +15% from a 305 entry. Given analysts see ~26% upside to 383 GBp over 12 months , exiting around 350 is a conservative swing target that doesn’t overstay the bounce. Aggressive traders might hold for 370–380 if momentum is strong and commodities rally.
-
Stop-Loss: 285 GBp (just under the recent 52-week low of ~290). A break below 290 would imply the downtrend is continuing and invalidate the bounce setup. This stop is ~5–6% below entry, which is tight given Glencore’s volatility – you may allow slightly more room if needed, but definitely exit if selling accelerates under £2.80.
-
Technical Signals: Rebound expected. RSI off extreme lows ; watch for RSI crossing 30 upwards as confirmation of recovery. Look for a bullish MACD crossover on the daily chart. Volume: A surge in volume on up-days (relative to down-days) will confirm institutional buying. If price pushes above 335 GBp (first resistance), the swing has strong momentum and could extend to 360+. On the flip side, any close below 290 would be bearish.
-
Recent News to Monitor: Keep an eye on Glencore’s half-year production report and earnings (due in early August) – these could significantly move the stock. Positive surprises in trading income or a smaller production shortfall would help the bounce. Also, commodity news (e.g. copper prices rebounding or China announcing stimulus) can rapidly improve sentiment. Notably, J.P. Morgan recently reiterated an “Overweight” on Glencore, highlighting its generous capital returns and undervaluation, with about 20% upside seen . Such sentiment from major brokers often marks a turning point when a stock has been oversold.
Day Trading Picks (High Volatility Plays)
Day traders thrive on high volume and high volatility stocks – those that can move rapidly intraday on news or momentum. In 2025, the U.S. market offers several mega-cap names that routinely swing multiple percentage points in a day, providing ample trading range. We highlight two popular day trading candidates and discuss one scenario in the UK.
Tesla (TSLA) – Volatile EV Leader with Big Intraday Swings
Figure: Tesla (TSLA) intraday price action example – frequent $10–20 swings offer day trading opportunities.
Why Day Traders Like It: Tesla is arguably the most traded stock by retail day traders. It has all the ingredients: huge liquidity (tens of millions of shares daily), a large beta (~2.0) meaning it’s about twice as volatile as the market , and constant news flow. In 2025, Tesla’s stock has seen dramatic intraday moves – for instance, a 7.8% drop in a single session on July 7 after a surprise political announcement by CEO Elon Musk . These large moves (often $10+ swings in the stock price within hours) are ideal for intraday scalping or momentum trading. TSLA often trades in a wide daily range (e.g. $15–20 range on active days when catalysts hit).
Volatility Catalysts: Tesla’s volatility stems from both company-specific events and its cult-like trading popularity. In 2025, Musk’s ventures and comments have added extra whipsaw: for example, Musk’s involvement in politics (launching an “America Party”) sparked investor jitters about his focus, contributing to Tesla stock’s ~23% YTD decline and big down days . On the flip side, anticipation of Tesla’s quarterly deliveries or earnings can fuel frenzied rallies (or sell-offs) on rumor and news. The company’s upcoming Q2 2025 earnings (late July) is a case in point – traders position for either a surprise (which could rip the stock higher intraday) or disappointment. Tesla also reacts sharply to macro news (interest rate changes, as growth stocks are sensitive) and sector news (EV sales data, competitor announcements).
Additionally, options activity on Tesla is enormous, and gamma squeezes can amplify intraday moves. For instance, in July a burst of put option buying (14,000+ contracts at $320 strike) was noted ; such flows often cause rapid price swings as market makers hedge.
Technical Day Trade Levels: As of mid-July, Tesla trades around ~$310. Intraday, traders are watching support near $300 (a psychological round number and recent low) and resistance near $330–$335 (recent swing high zone). These levels often act as pivots during the trading day – e.g. if Tesla breaks below $300 in the morning on high volume, momentum sellers may push it quickly toward $290. Conversely, if it clears $330, shorts covering can spike it to $340. Tesla’s intraday volatility is also evident in its Average True Range (ATR), which is roughly $8–10 (on a $310 stock, that’s ~3% per day typical range, with bigger days far exceeding that).
Risk Management: While rewarding, Tesla is high-risk. A single tweet from Elon or an unexpected headline can send the stock ripping in either direction within minutes. Day traders manage this by using tight stop-losses and preferring defined setups (like breakouts of key levels or quick scalps off known support). Many day traders also trade Tesla via options (weeklies) to leverage these moves, though that adds complexity.
Example Day Trade Scenario: On July 7, when Musk’s political news hit, Tesla opened with a gap down. A day trader might have shorted the break of the $300 level in early trade, riding it to ~$294 support and covering, then reversed to a long when it stabilized – all within one session, capturing multi-dollar moves each way. Another scenario: a trader might buy a VWAP bounce – Tesla often retraces to the VWAP (volume-weighted avg price) intraday and bounces if overall sentiment is bullish, offering a low-risk entry with tight stop below VWAP.
Key Point: Tesla’s intraday pattern often includes feints and reversals. It’s common to see rapid oscillations – e.g. a morning spike, midday fade, then an afternoon rally. Seasoned traders watch level 2 order flow and momentum indicators.
-
Day Trade Bias: Neutral/Biased to Momentum. TSLA can be traded both long and short intraday. Current overall trend is choppy – down YTD but off recent lows – so traders play the short-term momentum (follow the tape). Given its high beta, aligning trades with NASDAQ direction on the day can help (Tesla often magnifies NASDAQ moves).
-
Important Intraday Levels: Support: $300, then $290. Resistance: $330, then $350. Round numbers ($300, $320, $330…) tend to attract action.
-
News Catalysts: Upcoming earnings (late July) – expect pre-earnings volatility and big post-earnings move. Also watch out for: monthly China EV sales (Tesla’s China sales down 30% YoY in May – any improvement could spike the stock), any updates on FSD (full self-driving) or the Cybertruck launch timeline, and macro news (interest rate decisions, as Tesla is sensitive to growth expectations).
-
Analyst/Flow: Many analysts have turned cautious on Tesla due to its lofty valuation (forward P/E ~150×) and Elon’s distractions. J.P. Morgan still has a Sell. However, ARK’s Cathie Wood remains ultra-bullish, and retail flows often follow her pronouncements. Be aware that investor sentiment can shift intraday on even minor news for Tesla. The stock’s high short interest and option gamma mean it can ignite into short-covering rallies quickly if it starts to rise, which is exactly what day traders crave.
NVIDIA (NVDA) – Momentum King for Active Trading (U.S.)
Why Day Traders Like It: NVIDIA has been the poster child of the 2023–2025 AI-driven rally, with its market cap soaring to an astounding $4 trillion in 2025 . This meteoric rise made NVDA extremely volatile intraday – large swings as traders price in perfection or fear of heights. On heavy days, NVDA’s stock often trades $20+ range. For example, around its earnings in May 2025, NVDA opened up 10%, then sold off intraday, only to bounce again – a rollercoaster ideal for nimble traders. It’s a high-priced stock (~$450/share mid-2025 after massive gains), which means even 1% moves are several dollars.
Volatility Catalysts: NVDA’s fortunes are tied to AI-chip demand, and any news about orders, supply constraints, or competition (like AMD’s new GPU announcements) causes big moves. Moreover, as one of the most valuable companies, NVDA reacts to macro news (interest rates, inflation) significantly. When NVIDIA’s market cap hit $4T , it was largely on hype – making the stock prone to rapid profit-taking. Intraday, NVDA often has strong trending moves in the first and last hours, with algo-driven swings mid-day.
Day Trade Characteristics: NVDA is highly liquid (though less so than Tesla in share count, but similar in dollar volume). It tends to respect technical levels – day traders watch pre-market highs/lows and prior day’s support/resistance for cues. Volatility around key times (like 10am reversal or 3pm power hour) is notable. NVDA options are also very active, contributing to quick delta-hedging moves.
Trading Strategy: Many day traders use momentum breakout strategies on NVDA. For instance, if NVDA breaks the high of the day on volume, it often runs another 1–2%. Conversely, breakdowns can accelerate. The stock’s high price means some prefer trading it via QQQ or SOXL (leveraged ETF) for lower capital outlay, but direct NVDA trading offers cleaner action.
-
Recent Intraday Levels: NVDA recently found intraday support around $420 and resistance near $480 (a big round number). Breaks of these tend to be meaningful.
-
Caution: NVDA’s rapid moves mean tight stops can get wicked out. It’s important to either give some room or be quick to re-enter if a head-fake occurs.
-
Catalysts: Upcoming developer conferences, product announcements (the next-gen GPU launch), and any AI news (e.g. major cloud companies’ orders) will spike NVDA. Also, keep an eye on competitor news (if, say, AMD claims a big AI chip win, NVDA might fall intraday).
-
Example: On a day the market is strong and NASDAQ is grinding up, a day trader might notice NVDA leading. They could buy NVDA when it breaks a bull flag at, say, $450, ride it to $460, then get flat. Alternatively, on a weak day, shorting a break of support could yield quick $10 downmoves. NVDA can easily move 4-5% in a few hours when momentum is there.
Day Trading in FTSE 100 Stocks (UK)
Day trading opportunities in FTSE 100 names are comparatively fewer than US tech, because UK large-caps often have lower volatility. However, there are instances where UK stocks do make big intraday moves – usually around news or earnings.
-
Example – Barclays (BARC.L): A UK bank like Barclays typically has modest daily moves (~1-2%), but on July 11, 2025, after an earnings update, Barclays surged over 4% intraday, breaking through 340 pence to new highs . Traders who caught the breakout above the previous high (~334p) profited as the stock ran to ~345p. Barclays has been in a strong uptrend (shares +40% in 2025) and recently hit 344p , exceeding prior resistance without weakness. Day traders watch such momentum – buying on intraday pullbacks or breakouts. A median analyst forecast sees 370p (+11%) in 12 months , meaning most of Barclays’ big repricing might have occurred, so future intraday moves may revolve around Bank of England rate news or financial results. Also note: Barclays’ high liquidity (it’s heavily traded in London) means tight spreads, favorable for quick trades.
-
Example – Glencore (GLEN.L): We already discussed Glencore as a swing, but it’s also a day trader’s play when commodities jump. If copper or oil prices spike overnight, GLEN can gap up and run 3-5% in a session. Its beta is high, and it reacts to headlines (e.g., a mining strike news can send it surging). The caution is that UK trading hours often miss the most volatile overnight commodity moves that happen during US/Asia time.
In general, FTSE 100 day trades often center on market-wide news (like inflation data or central bank announcements) that move the index. Individual UK stocks to watch for day trades include energy companies (BP, Shell) which move with oil prices – e.g., BP can jump 3% intraday if OPEC news sends Brent crude up sharply. Another example: Vodafone (VOD.L) occasionally pops on takeover rumors or strategic announcements (its new CEO plans), yielding a rare 5%+ day.
Key Takeaway: For day trading, US markets currently offer far more action than UK markets. Traders in London often end up focusing on US equities or indices in the afternoon for volatility. However, opportunistic trades on UK names are possible when a clear catalyst hits a company (earnings surprise, M&A news, regulatory decisions). Always pay attention to volume – a big volume surge in a normally slow FTSE stock is a tip-off that something is happening and a larger than normal move could be underway.
Short-Term Investing (Target ~10% Returns)
“Short-term investing” here refers to trades or investments over a few weeks to a few months, aiming for single-digit to ~10% gains. These are often driven by specific catalysts or mild undervaluation – less volatile than swing trades, but more active than long-term holds. We highlight a few picks where a ~5–10% upside is realistic in the near term (with relatively controlled risk).
Walt Disney Co. (DIS) – Short-Term Rebound on Streaming & Parks Momentum (U.S.)
Figure: Disney (DIS) stock recovering from ~$90 lows toward analysts’ ~$125 average target, with bullish calls up to $140.
Thesis: Disney’s stock is poised for a short-term uptick (~10% potential) as the company’s fortunes begin to turn. Trading around ~$118, DIS is up ~11% in 2025 (and ~25% off its 2024 lows) , yet still below many analysts’ targets. Recent catalysts – strong earnings, streaming improvements, and a cruise business boost – have improved sentiment, suggesting Disney could grind higher toward the low-$130s in coming months.
Fundamental Drivers: In its latest quarter (reported May 2025), Disney beat expectations, posting $1.45 EPS and $23.62B revenue . Crucially, its Disney+ streaming subscriber base ticked up after prior declines, and the company announced cost-cutting and content reshuffling that Wall Street embraced . Parks and Resorts remain a bright spot with robust attendance and spending (helped by pent-up travel demand). Disney’s forward P/E ~20 is reasonable for its growth outlook (EPS expected to grow ~8% CAGR over the next 3 years). The stock’s consensus 12-month target is ~$125 , only ~5% above current price, but several analysts have raised targets into the $130–140 range on the back of recent results . For instance, Guggenheim hiked its target to $140 (up from $120) and Rosenblatt to $140 (from $135), citing confidence in Disney’s earnings trajectory . These bullish revisions indicate that sentiment is turning positive.
Catalysts Ahead: Disney’s new CEO Bob Iger’s turnaround efforts are a key catalyst – he’s exploring strategic options like perhaps selling Hulu stake or finding a sports betting partner for ESPN, which could unlock value. In the short term, upcoming movie releases (Disney has a strong film slate in late 2025) and the continued recovery of the cruise line and theme parks (international visitors returning) provide tailwinds. Also, Disney’s board is discussing reinstating its dividend by end of calendar 2025; any hints of that could lift the stock. On the streaming side, if Disney+ can show reduced losses (on track for profitability by FY2025), that would further bolster investor confidence.
Technical Setup: Disney stock hit a low around $90 in late 2024 amid streaming pessimism. Since then, it’s been making higher lows. It recently broke above its 200-day MA (~$112) and is testing the $120 resistance zone. Support lies around $110–$112 (previous resistance now support). Resistance near-term is $125 (which, not coincidentally, is around the average analyst target and the high from April 2025). A push through $125 could see quick follow-through to ~$130. The RSI ~60 is not yet overbought, leaving room for further upside. Volume patterns show accumulation on up-days, suggesting institutional buying. All in all, the technical picture aligns with a steady grind higher, rather than a volatile jump – suitable for a short-term investment.
Risk Factors: Key risks include any downturn in consumer spending that could hit park attendance or a flop in the film slate (e.g., if an expected blockbuster underperforms). Also, streaming competition remains intense – surprises from Netflix or others could pressure Disney. However, these seem manageable in the near term, and Disney’s diversified segments provide a cushion.
-
Buy Range: ~$115 or below. Investors looking for ~10% upside can buy in the mid-teens where support lies.
-
Target Exit: ~$127–130. This would be about 10% above recent prices. Notably, multiple analysts’ targets cluster in the high-$120s and low-$130s , which might act as a natural magnet if sentiment stays positive. A more aggressive short-term target could be $135 (top of its 1-year range, and where Loop Capital set its target) , but one can start taking profits around $125+.
-
Stop-Loss: ~$105. If Disney falls back below $110 (its 200-day), it may retest double-digits. A stop ~105 limits downside to ~-$10 (about -8%), a reasonable risk for ~+10-12 upside. This would likely only trigger if broader markets sell off or if Disney has an unexpected setback.
-
Recent Events: Disney’s earnings call in May noted Disney+ added 1.1M subs, reversing a decline, and management forecast smaller streaming losses ahead . Additionally, activist investor Nelson Peltz has been in and out – any renewed activist involvement could also drive shares. So far, analyst sentiment is improving: 17 Buys, 6 Holds, 2 Strong Buys, 0 Sell , which is a more bullish skew than earlier in the year. Short interest is low (~1.2% of float), meaning no major squeeze risk but also no heavy overhang. We’ll also watch the broader media sector – positive news from peers (e.g., Netflix subscriber beat) often gives Disney a sympathy lift.
Barclays PLC (BARC.L) – Steady Climb with Further ~10% in Sight (U.K.)
Thesis: Barclays, the British banking giant, has been on a steady uptrend in 2025, and still offers close to 10% upside in the short-to-medium term when considering its dividend. The stock trades around 338 GBp after a strong rally (it started 2025 near 240p and is now +40% YTD) . City analysts’ median 12-month target is ~370p , which is ~9-10% above current – aligning with a short-term return goal, especially when adding the ~3% dividend yield for the year .
What’s Driving Barclays: UK banks have benefited from rising interest rates (which expand net interest margins). Barclays in particular reported solid earnings in Q1 and Q2 2025 – e.g., Q1 net interest income rose 3% YoY – and it maintained a strong capital position (CET1 ratio ~13.6%). The company also has a robust investment banking arm that surprisingly performed well despite market volatility, helping overall profits. With the Bank of England raising rates to combat inflation, Barclays’ lending margins are near multi-year highs. However, the market remains cautious on UK banks due to potential 2025 rate cuts if the economy slows, which could compress margins again . That caution is why Barclays, despite its rally, still trades at a low P/E ~9 . In fact, its P/E of ~9.3 is only slightly above its historical average of ~8.9 – indicating the stock isn’t expensive.
Catalysts: Barclays will announce its half-year results soon (early August 2025). If it confirms earnings resilience and perhaps raises its dividend or buyback (there’s chatter that excess capital might be used for buybacks), the stock could leg higher. Additionally, any clarity on the Bank of England rate trajectory (if inflation remains high, BoE may hold rates higher for longer, benefitting banks) would support Barclays. On the flip side, if UK recession risks grow, that could temper enthusiasm. But short term, economic data has been decent, and UK unemployment remains low – conducive for bank credit quality.
Technical Picture: Technically, Barclays’ chart is in a strong uptrend (short, medium, and long term signals all bullish) . It recently broke above a key resistance ~330–335p (the highs from 2021 and 2022) and hit 344.9p . Notably, this new high was achieved on strong momentum and no sign of weakness . This breakout suggests the potential for the stock to continue to “ride the trend”. Support now sits around 315p (identified as a critical area that was former resistance) . As long as Barclays stays above ~316, the bullish structure is intact. Resistance ahead isn’t very well-defined since the stock is at multi-year highs; round levels like 350p may act as psychological resistance, and of course the 370p analyst target could be a medium-term ceiling. Oscillators (RSI ~65) show a bit of near-term overbought condition, which could mean a brief consolidation, but nothing alarming yet .
Short-Term Trade: The idea would be to hold Barclays for the next catalyst (earnings) and potentially a bit beyond, capturing the remaining upside plus dividend:
-
Entry: Current levels (~338p) or on any minor dip to 330p (in case of general market pullback).
-
Target: 370p. This matches the median analyst forecast and would be ~+9% from 338. Including the dividend (next interim dividend expected in Sept), total return goal ~10%. If one is slightly more bullish, the prior cycle high around 380p (from 2017) could be a stretch target, but 370 is prudent.
-
Stop: A drop below 315p. That’s ~7% downside protection. Below 315, the uptrend would be in question (since 315 was noted as must-hold for bullish bias) . One could also use a time-based stop (e.g., if the thesis hasn’t played out by year-end 2025).
-
Upside Drivers: Watch for earnings on Aug 3 – if Barclays surprises with stronger investment banking fees or lower provisions, the stock can pop. Also, any indications of share buybacks. Barclays is also somewhat sensitive to US markets (it has a big US presence), so continued strength in global banks (like US banks’ earnings beats) helps.
-
Risks: If the Bank of England signals rate cuts sooner than expected (e.g., if UK inflation rapidly cools), bank stocks could sag. Also, any shock (like a spike in loan defaults or a regulatory fine) could hurt. However, Barclays’ fundamentals appear solid near term: it’s trading below tangible book value, and has excess capital – usually a safety buffer.
In summary, Barclays isn’t a high-flyer, but it’s on a positive trajectory. A ~10% return seems attainable given the supportive trend and valuation – making it a suitable short-term investment idea.
BP plc (BP.L / BP) – Range Trade ~10% on Energy Resilience (U.K.)
Thesis: BP, the British energy major, offers a short-term opportunity of around 8–10% as it trades near the upper half of its 2025 range but with strong operational momentum. BP’s stock is about 400 GBp as of mid-July. It has been fluctuating roughly between 360 and 480 GBp over the past year. Currently, BP is around 402p (Jul 11 close) after a recent rally, and technicals suggest it could make a push toward its 52-week high ~458 GBp – approximately 10% above – if oil market conditions stay favorable.
Recent Performance: In Q2 2025, BP provided a trading update that impressed the market: refining margins jumped ~40% quarter-on-quarter, and BP’s trading division offset weaker oil prices . The stock surged ~3.7% in one day (to ~$32.7 in ADR, ~£32.7) on that news , breaking above a key $32.5 resistance on the NYSE (≈3250 GBp equivalent) . This move showed that investors are focusing on BP’s operational resilience – it can make money even when oil prices (Brent averaged $68 in Q2 vs $75 last year) are lower, thanks to strong trading results and refining margins . BP did caution about some one-off impairments ($1.5B) but the market shrugged it off .
Catalysts: Short-term, BP’s next earnings (full Q2 results) in early August will be key. If they show continued share buybacks (BP has been repurchasing shares heavily) and maintain the dividend, income investors will stick with it. Additionally, oil prices have rebounded somewhat from early 2025 lows; any further uptick in crude (e.g., if OPEC+ enacts cuts or if demand surprises to upside in H2) would likely push BP higher. BP is also progressing on asset sales (targeting $25B by 2025) which could bring positive news.
Technical Setup: Support for BP (London) lies around 380 GBp – that’s where it based before the recent jump. Resistance is the year high ~458 GBp (from April). Another intermediate resistance is ~430p (a level where the stock peaked multiple times). BP’s RSI ~53 is neutral after the recent rally – not overbought . It remains above its 200-day MA(~307p in ADR terms, which is ~$30.7; BP ADR now ~$32.7) , indicating an ongoing uptrend. According to technical analysts, as long as BP holds above ~$31.5 (in ADR) or ~3150 GBp, momentum remains bullish . Bulls have an eye on $35.83 (ADR) which is the 52-week high (for London that’s ~£4.58) . Reaching that would complete a 10% move from current levels. Option traders have been positioning around $33–34 strikes for July, reflecting a short-term bullish bias .
Trade Strategy: This is slightly more speculative given energy price volatility, but BP’s downside seems cushioned by buybacks and dividend (yield ~4% annually).
-
Entry: ~390–400 GBp (current area).
-
Target: 440–450 GBp. That’s ~+10–12% from 400. One could also set a trailing exit if it nears that zone. The goal would be to capture a rally toward the top of the range.
-
Stop: ~370 GBp. If BP falls under 370, the recent breakout would have failed and downside to 360 or below could open. This stop is ~-7.5% from 400.
-
Risk/Reward: Roughly 1:1.3 (not as high as other trades, but BP is somewhat lower volatility). The trade thesis relies on a moderately bullish oil/market scenario; it’s not without risk (if oil dumps to $60, BP will likely fall).
-
Why BP now?: Because it demonstrated it can “beat” on earnings even with lower oil (thanks to refining/trading) , suggesting downside earnings protection. Also technical momentum is on its side – it’s in an uptrend channel.
-
Recent News: BP’s CEO has been emphasizing the energy transition, but notably BP dialed back some green targets (like slower production cuts), which investors took positively earlier in 2023. In July, BP also acquired travel EV charger companies (showing they invest in growth), but these are small bets. The overarching factor is oil/gas prices. Europe’s gas prices have stabilized, and BP is a big gas trader too. Their Q2 trading update implies trading profits remain robust even as pure oil extraction profits fell . That narrative could carry the stock upward until something fundamentally changes.
Note: Short-term investors in BP should keep an eye on macro: any major recession signals could hurt oil demand and thus BP’s price. Also, BP is exposed to geopolitical risk (though less so than pure upstream players, since it’s integrated). The recent India-Russia oil trade shifts didn’t hurt BP specifically , as it’s more company-specific execution that’s driving it now. In fact, BP’s outperformance vs Exxon recently (BP +3.7% day vs XOM +0.3%) highlights that stock-specific catalysts (like BP’s good refining results) can overcome sector trends in the short run – a plus for this trade.
Conclusion: Across these categories – long-term, swing, day trading, and short-term – we’ve identified a variety of investable stock ideas from the US and UK markets. Long-term investors might accumulate quality names like Apple, J&J, Unilever for their durable business models and dividends. Swing traders can look at oversold rebounds such as Nike or Glencore to ride multi-week recoveries. Day traders have fertile ground with Tesla, NVIDIA and other high-fliers for quick intraday profits (while exercising strict risk control). And short-term investors targeting ~10% moves have opportunities in names like Disney, Barclays, and BP, which are backed by improving fundamentals and reasonable valuations.
By aligning stock selection with one’s trading style and risk tolerance – and by staying attuned to both technical signalsand fundamental news – traders and investors can increase their odds of success. Always ensure to monitor the latest news and analyst updates (as we have cited throughout), since markets in 2025 remain sensitive to earnings reports , economic data, and geopolitical developments. Diversification across sectors and regions (as in the picks above) can also help manage risk. Happy investing/trading!
Sources: Recent financial news and analysis were referenced from Reuters, Yahoo Finance, MarketBeat, Investors Chronicle, Tickeron AI blog, DirectorsTalk Interviews, and company reports to validate the data and targets mentioned , among others. All price targets and technical levels are based on these sources and prevailing market conditions as of July 12, 2025. Please conduct further research as needed and consider consulting a financial advisor for personalized advice.