Trading Strategy
MACD + 200 MA Trading Strategy with exit points
Jun
MACD Strategy + 200 MA Trading Strategy
Category: Trading Strategies | Quantina Intelligence Ltd.
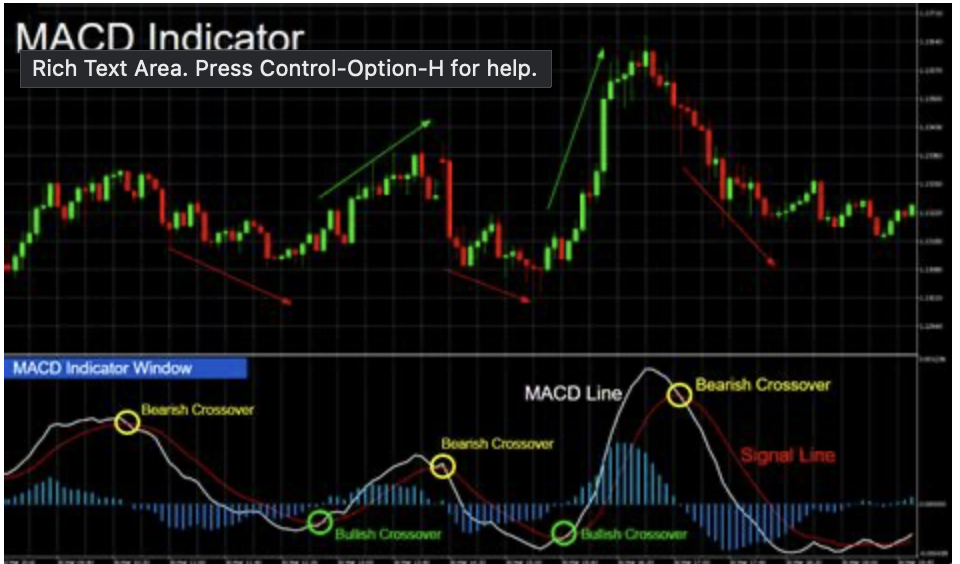
1. Overview: MACD Indicator Basics
The MACD (Moving Average Convergence Divergence) is one of the most popular tools in technical analysis. It identifies changes in the strength, direction, momentum, and duration of a trend.
Key Components:
- MACD Line = 12 EMA – 26 EMA
- Signal Line = 9 EMA of the MACD Line
- Histogram = MACD Line – Signal Line
Basic Entry Rules:
- Buy Signal: When the MACD line crosses above the signal line
- Sell Signal: When the MACD line crosses below the signal line
2. Trend Confirmation Using the 200 Moving Average
To improve the quality of MACD signals, we use the 200-period Moving Average (MA) as a trend filter.
Trade Only in the Direction of the Trend:
- Buy only when price is above the 200 MA
- Sell only when price is below the 200 MA
This filter helps eliminate false signals during sideways markets.
✅ 3. Entry Rules Summary
| Condition | Action |
|---|---|
| Price above 200 MA | Look for Longs |
| MACD line crosses above Signal | Enter Long |
| Histogram turns positive | Confirm Long Entry |
| Price below 200 MA | Look for Shorts |
| MACD line crosses below Signal | Enter Short |
| Histogram turns negative | Confirm Short Entry |
4. Extra Trick: Use a Trailing Stop to Hedge Profits
While your entry point is crystal clear (MACD crossover confirmed by MA200 trend), how you exit can drastically affect your profit outcome.
➕ Advanced Tip: Trailing Stop = Dynamic Profit Hedging
Using a Trailing Stop allows your trade to remain open as long as the market moves in your favor — and closes only when the trend reverses.
Benefits:
- Locks in profits while giving room for trend continuation
- Turns this setup into a hedge-style profit strategy
- Helps avoid premature exits while protecting against reversals
Example:
After a long entry, set a trailing stop of 30–50 pips (or based on ATR). The stop will adjust upward with price — locking in gains while letting the trade run.
5. Sample Python Code
import pandas as pd

data['EMA12'] = data['close'].ewm(span=12).mean()
data['EMA26'] = data['close'].ewm(span=26).mean()
data['MACD'] = data['EMA12'] - data['EMA26']
data['Signal'] = data['MACD'].ewm(span=9).mean()
data['MA200'] = data['close'].rolling(200).mean()

# Define Long Entry Conditions
data['Position'] = 0
cond_long = (
    (data['close'] > data['MA200']) &
    (data['MACD'].shift(1) < data['Signal'].shift(1)) &
    (data['MACD'] > data['Signal'])
)
data.loc[cond_long, 'Position'] = 1
Final Thoughts
This combined strategy merges MACD momentum with the MA200 trend filter, giving you high-probability trades aligned with major market direction.
Best for:
- H1 or H4 timeframes
- Major forex pairs or trending stocks
- Low-news or technical-trend environments
Refine and backtest before applying to real accounts.
Want more strategies like RSI + MACD or Bollinger breakout filters? Contact Quantina today.